
15 developer productivity metrics that elite teams track

The problem with the way that most software engineering teams are measuring development productivity is that their engineering metrics still measure activity instead of system performance.
That can be useful at a team level, but as leaders, we need to understand movement across the entire SDLC. In modern software delivery, activity is cheap, not least because of AI – teams can look busy, but overall performance is not necessarily rising. In fact, it can even fall as a result.
Elite engineering teams have mastered this. They’re not optimizing for output, but rather, how value gets delivered, and using engineering productivity metrics to support this.
What are developer productivity metrics?
Software development productivity metrics measure how effectively software teams deliver value. The most useful metrics reveal how work flows through the SDLC, where delivery slows down, and whether engineering output is improving business outcomes over time.
Why should engineering teams measure productivity?
Measuring software development productivity helps leaders identify bottlenecks, reduce operational overhead, improve planning accuracy, and accelerate the flow of value to customers.
We can’t improve delivery if we can’t see where friction exists inside the system.
The goal is not to maximize developer activity, but to understand whether teams are delivering software faster, more predictably, and with sustainable quality.
What metrics do elite engineering teams track?
As part of our 2026 Engineering Productivity Benchmarks, we analyzed data from 2000+ engineering teams to understand what separates elite performers from the rest.
We found that top-performing teams at organizations like the Ministry of Justice, Trainline and Sage tracked a small set of developer productivity metrics differently. More importantly, they used those metrics to identify system constraints before they became delivery problems.
Across those 2000+ teams, four dimensions consistently explained the difference between high-performing engineering organizations and the rest:
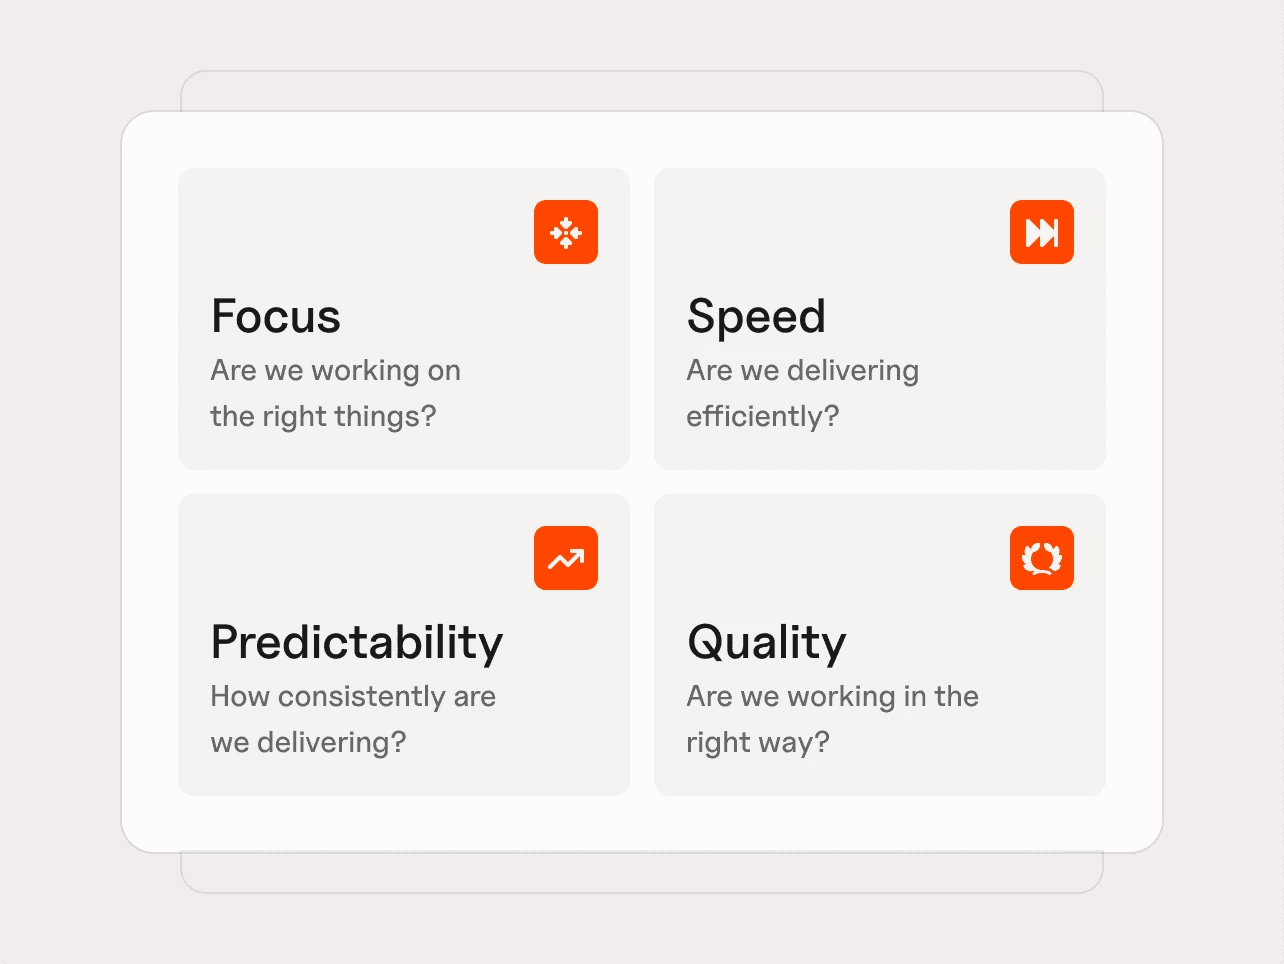
These are the Four Pillars of Engineering Productivity. Together, these pillars provide a balanced view of software delivery performance that consolidates and enhances DORA metrics, flow metrics and SPACE metrics — not just how much work teams produce, but whether delivery is actually improving.
Pillar 1 — Elite teams obsess over Focus
Focus measures how much engineering effort is spent delivering roadmap outcomes—and ultimately, value—versus maintaining the system through support, bugs, and operational overhead.
Elite teams monitor two core metrics closely:
1. Value Delivery %
Value Delivery % measures the proportion of engineering work contributing directly to roadmap outcomes and customer value.
High-performing teams aggressively protect this number because it reflects whether engineering effort is driving strategic progress or simply maintaining stability.
2. Support & Maintenance %
Support & Maintenance % measures how much engineering capacity is consumed by bugs, incidents, operational issues, and upkeep.
In low-performing teams, reactive work often dominates the delivery system. In our benchmarks research, some teams spend as little as 20% of their engineering effort on roadmap work.
Pillar 2: Elite teams optimize flow, not coding speed
One of the most common mistakes in engineering productivity is confusing developer activity with delivery efficiency.
Optimizing for writing code faster will almost always lead to severe software engineering bottlenecks. Instead, elite teams work out how to move work through the system more efficiently, because delivery days rarely occur during coding—they happen in waiting (e.g. for pull request reviews, approvals, testing and so forth).
Elite teams also understand that poor developer experience often shows up first as delivery friction inside the system.
1. Lead Time to Value
Lead Time to Value measures the total time from idea to production.
It reflects the true responsiveness of the delivery system. Our research found Lead Time to Value is often 5x longer than cycle time, making it one of the single biggest opportunities for improvement.
Top-performing teams consistently achieve Lead Time to Value under 22.5 days.
Elite organizations treat this metric as a system-level signal. If Lead Time to Value increases, the issue is rarely isolated. It usually reflects growing friction somewhere in planning, reviews, testing, release management, or prioritization.
2. Cycle Time
Cycle Time measures how long work takes from starting development to reaching production.
This is a core indicator of workflow health and delivery efficiency. Elite teams regularly review cycle time trends to identify anomalies and emerging bottlenecks before they become systemic problems. Importantly, they don’t analyze Cycle Time in isolation—they break it down into the stages creating the most delay.
Read about how to reduce cycle time here
3. Time to Merge PRs
Time to Merge PRs tracks review and integration latency.
This is one of the clearest indicators of delivery friction because pull request review delays create downstream slowdowns throughout the SDLC. We found that teams keeping PR merge times under 24 hours consistently delivered faster and experienced fewer integration conflicts.
Time to Merge PRs typically accounts for 20–30% of total Cycle Time, making it a major optimization opportunity.
4. Throughput Quotient
Throughput Quotient measures output normalized by team size and cycle time.
The limitation of raw throughput is that it measures volume without context. Raw output alone can be misleading. More pull requests or deployments do not necessarily indicate better delivery performance.
Throughput Quotient helps engineering leaders understand true efficiency relative to available capacity. Elite teams use this metric to identify where workflow inefficiencies and bottlenecks are reducing delivery throughput.
5. PR Efficiency Quotient
PR Efficiency Quotient measures how effectively pull requests convert into merged output.
This highlights collaboration quality and review efficiency across teams. High-performing engineering organizations often use this metric to encourage smaller, more understandable PRs that reduce review times and lower the risk of defects.
6. Merge Frequency per Author
Merge Frequency per Author measures how often engineers integrate changes into the main branch.
Elite teams consistently favor smaller, more frequent merges. Widespread use of AI in code generation makes this metric even more important
The adoption of AI exacerbates this—code generation can dramatically increase output volume and overwhelm downstream review processes.
Pillar 3: Elite teams protect Predictability aggressively
Elite teams understand that consistent delivery matters just as much as fast delivery because unpredictability creates quality degradation and operational instability across the business.
The Predictability pillar measures how reliably teams execute against plans over time.
1. Sprint Capacity Accuracy
Sprint Capacity Accuracy measures completed sprint work relative to initial sprint commitments.
This metric reveals a team’s true delivery capacity and highlights whether planning assumptions align with actual execution capability.
Elite teams use this metric to improve planning realism rather than maximize utilization.
2. Sprint Target Completion
Sprint Target Completion measures the percentage of committed work successfully delivered during a sprint.
Top-performing teams typically sustain Sprint Target Completion rates between 80–90%.
Optimize for consistency rather than perfection. Constantly targeting 100% completion often creates unhealthy delivery pressure and distorted planning behavior.
3. Mid-Sprint Scope Change %
Mid-Sprint Scope Change % measures how much planned work changes during an active sprint.
High levels of scope change undermine delivery stability and make forecasting unreliable.
We found that the top 25% of teams maintained Mid-Sprint Scope Change at 58% or below.
4. Velocity Volatility
Velocity Volatility measures how stable delivery performance remains over time.
High volatility signals inconsistency and elevated delivery risk.
Pillar 4: Elite teams treat Quality as delivery capacity
Lower-performing teams often treat quality as a tradeoff against speed, while elite teams understand that the opposite is often true. Poor quality reduces future delivery capacity, and current delivery capacity is often affected by past quality issues.
1. Bug Resolution Time
Bug Resolution Time measures how long defects remain unresolved.
Long resolution times create compounding delivery drag by increasing backlog pressure and consuming future engineering capacity. Prioritize resolving defects to improve future delivery speeds.
2. Stories Delivered : Bugs Raised
This ratio shows whether new delivery work is generating additional defects.
Elite teams evaluate whether Stories Delivered and Bugs Raised are converging or diverging over time. If delivery output increases while defects rise disproportionately, the system is likely sacrificing sustainability for short-term throughput.
3. Bugs Resolved : Bugs Raised
This ratio measures whether engineering teams are keeping pace with incoming defect load.
Top-performing teams consistently resolve as many bugs as they raise (or better). This is one of the clearest indicators of sustainable delivery performance because it shows whether quality issues are stabilizing or accumulating.
How elite teams measure AI impact
Elite teams understand that more activity doesn’t necessarily correlate with better delivery. Of course, AI in software engineering can and almost always does mean more code, more PRs and more tickets completed — but if quality drops and bottlenecks grow, the system hasn’t improved.
To understand how to think about this, we can separate AI metrics into three categories:
diagnostic signals
system constraints
delivery outcomes
Diagnostic signals: is AI actually being used?
Elite teams still track adoption metrics like:
AI adoption rate
usage consistency (DAU/WAU)
feature mix
PR volume
estimated time saved per engineer
These signals help organizations understand how AI is being adopted across engineering workflows. But they’re not proof of productivity.
System constraints: where is AI creating pressure?
Elite teams use the Four Pillars metrics, or a variation of them, to monitor whether AI adoption is causing system-level bottlenecks.
AI-driven gains only matter if the delivery system can absorb the additional throughput. Otherwise, AI simply shifts the bottleneck downstream.
Read our guide on dealing with software delivery bottlenecks
Delivery outcomes: is the system actually improving?
Ultimately, elite teams evaluate AI through the Four Pillars framework to assess whether AI is affecting focus, speed, predictability or quality, either positively or negatively.
Focus — Is more engineering capacity reaching roadmap work?
Speed — Is Lead Time to Value improving?
Predictability — Is delivery becoming more reliable?
Quality — Are defect rates remaining stable?
Improve engineering productivity across all Four Pillars with Plandek
Elite engineering teams don’t improve delivery by chasing isolated metrics or pushing teams to produce more output. They improve it by understanding where work slows down, where engineering capacity gets drained, and what’s preventing the business from delivering value faster.
Plandek gives engineering leaders visibility across the Four Pillars of Engineering Productivity so you can understand how your delivery system is actually performing, not just how busy your teams are.
As AI accelerates coding output, that visibility becomes even more important.
Plandek helps you see where those bottlenecks are emerging before they become delivery problems, with a shared view of how work is flowing across the SDLC.
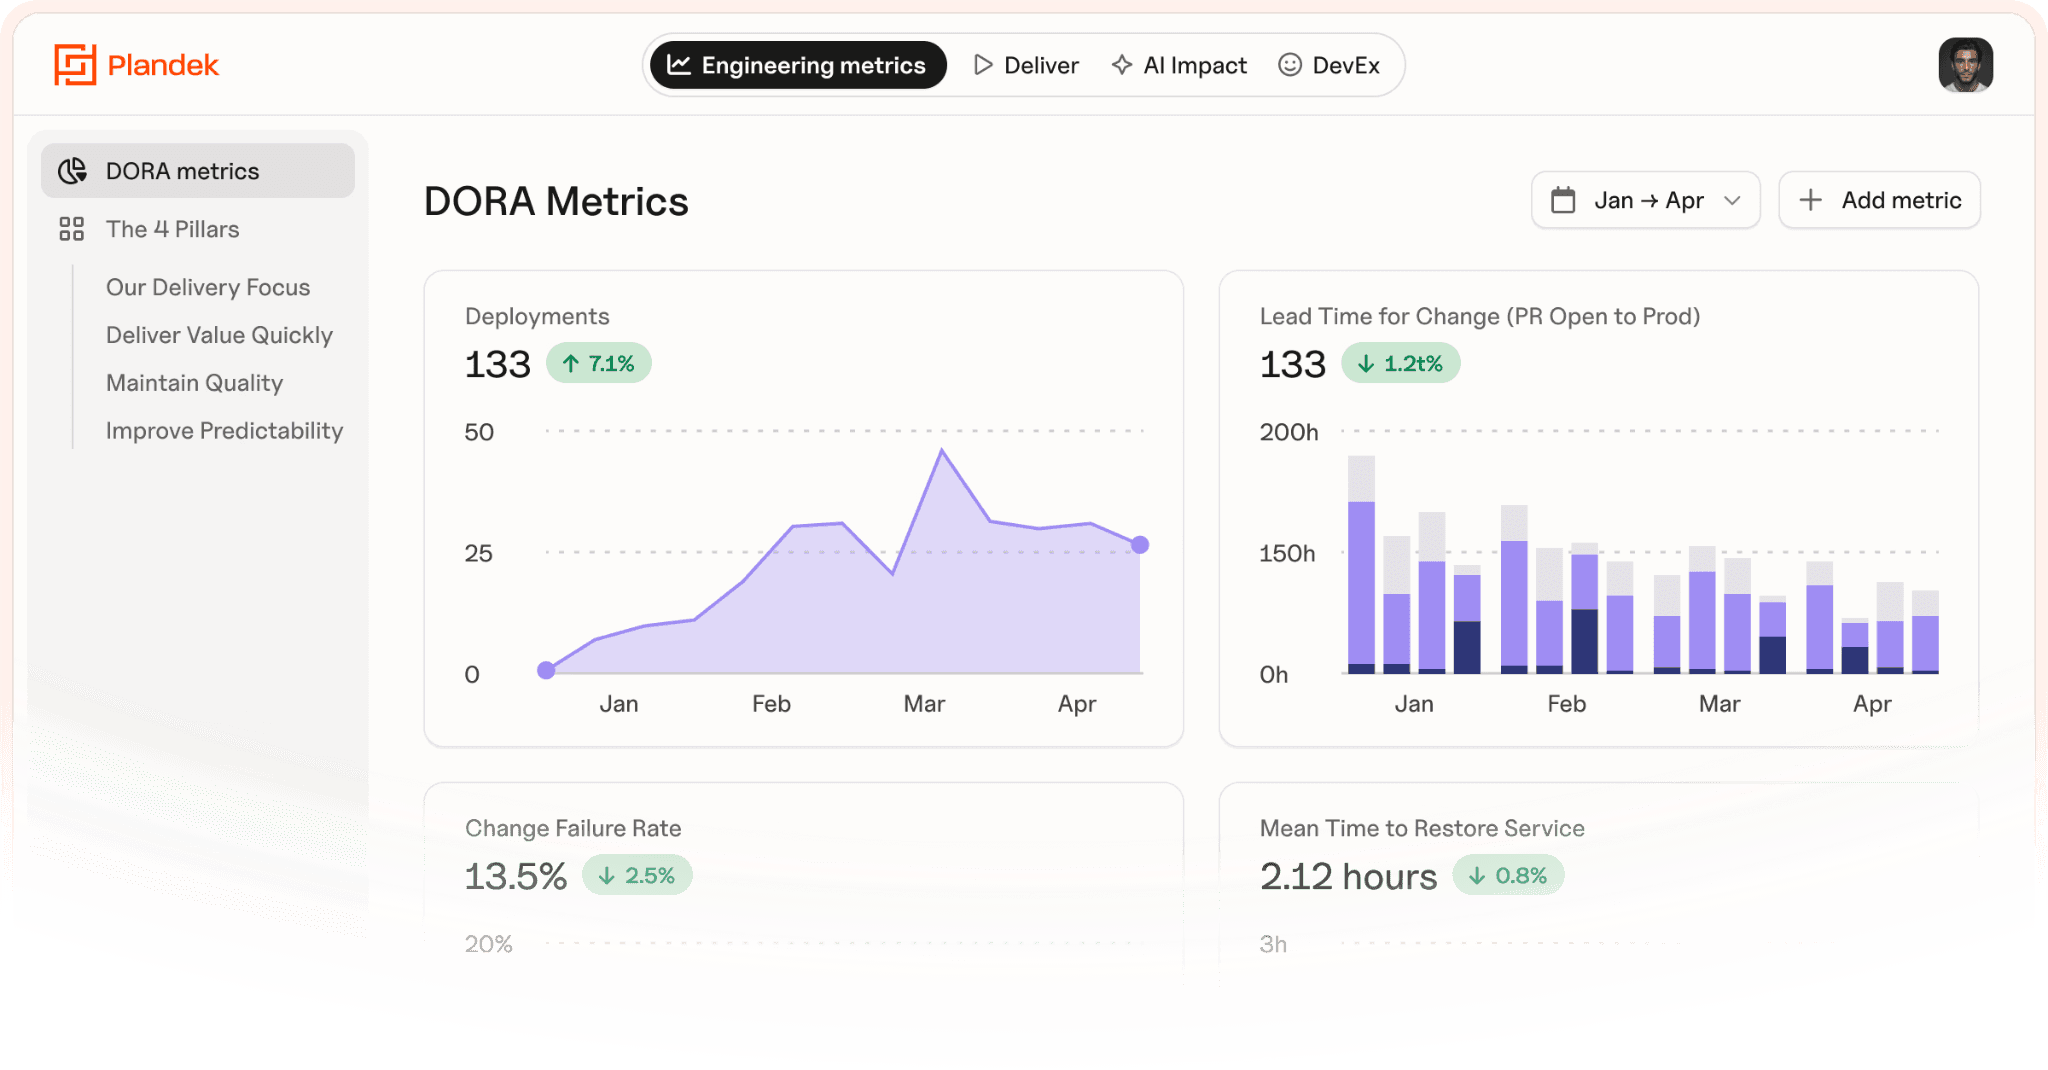
With Plandek, you can:
track the engineering productivity metrics that matter across all Four Pillars, along with 50+ more metrics
understand whether engineering effort is reaching roadmap work or getting lost in operational overhead
identify delivery bottlenecks like PR latency, workflow congestion, and sprint instability
measure the real impact of AI tools like Copilot, Cursor, Claude, and Devin on delivery outcomes
combine quantitative delivery intelligence with qualitative insight from engineers themselves
surface risks, blockers, and improvement opportunities through Dekka, Plandek’s AI Delivery Assistant
Want to see it in action? Book a free demo.
Key takeaways
Elite teams measure system performance, not just engineering activity.
The Four Pillars create balance across Focus, Speed, Predictability, and Quality.
AI productivity must be judged at a system-level, and by outcomes, not adoption, PR volume, or activity alone.
FAQs
What are engineering productivity metrics?
Engineering productivity metrics measure how effectively engineering teams deliver software. The best metrics show whether teams are delivering valuable work quickly, predictably, and sustainably.
What is the Four Pillars framework?
The Four Pillars framework, created by Plandek, helps leaders understand software delivery as a system by measuring Focus, Speed, Predictability, and Quality, rather than a collection of isolated metrics.
How do you measure engineering productivity in software teams?
Measure engineering productivity by looking at whether teams are working on valuable priorities, how efficiently work flows through the SDLC, how reliably teams deliver, and whether quality is improving or degrading.
How should engineering teams measure AI productivity?
AI productivity should be measured by its impact on delivery outcomes. Adoption, usage, and PR volume are useful signals, but the real test is whether AI improves Focus, Speed, Predictability, and Quality.


See how your engineering efforts translate into measurable business impact
Measure delivery performance, AI impact, and engineering productivity with hundreds of metrics, OOTB dashboards and custom configurations.












NEW
Contact us
UK Office
Unit 313 The Print Rooms, 164-180
Union St, London SE1 0LH
US Office
Floor 4, 1515 Mockingbird Ln,
Charlotte, NC 28209, USA