Plandek vs Azure DevOps

Plandek connects the dots across the entire SDLC and provides teams, managers and technology leaders with engineering insights to drive performance improvement and accelerate value delivery. Build your first report in minutes!
Plandek app icon โ€” orange rounded square with white interlocked geometric maze logo mark
Azure DevOps app icon โ€” white rounded square with blue origami-style folded arrow logo mark

Trusted by the worldโ€™s leading engineering teams

Build custom reports to find the answers to your engineering questions

Build custom reports to find the answers to your engineering questions

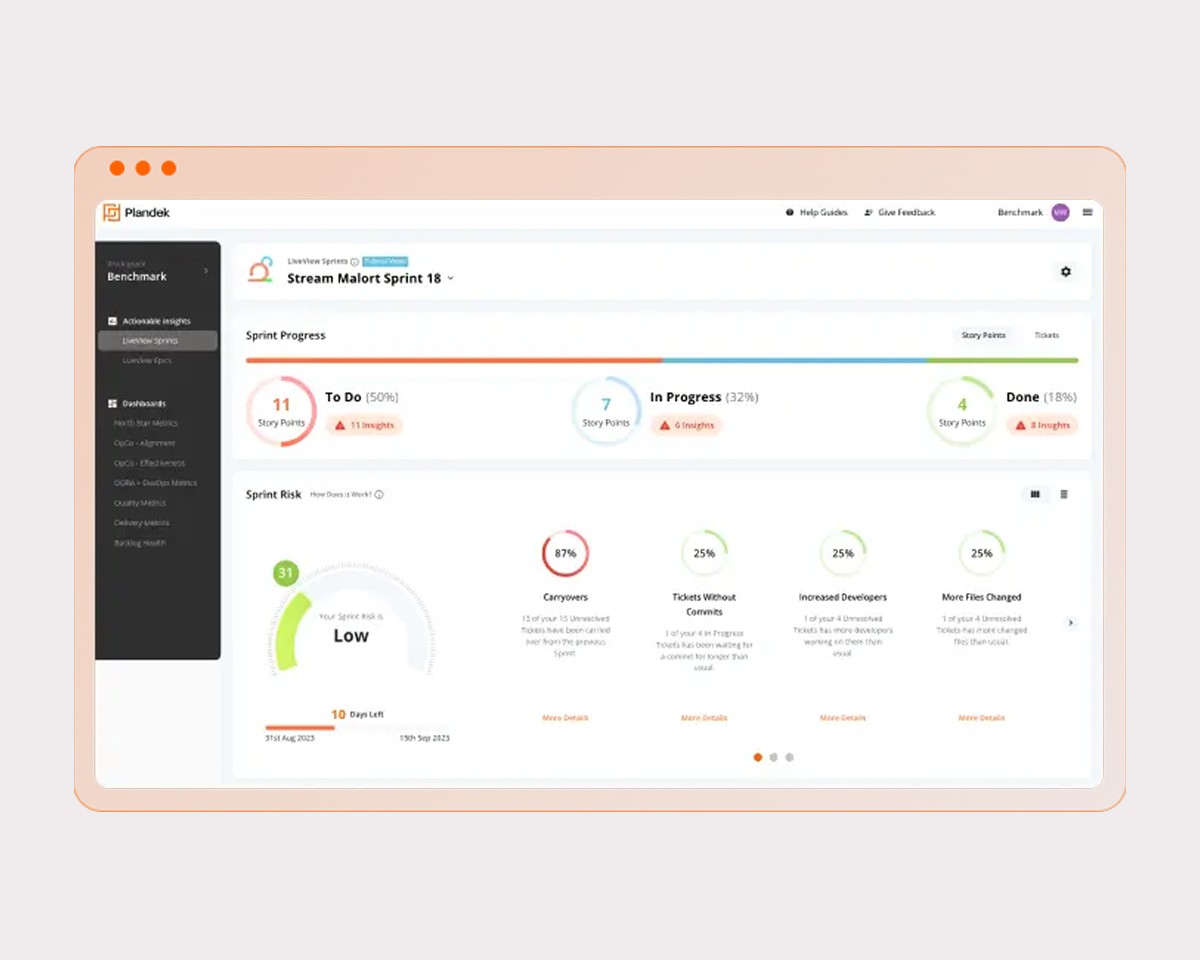
Plandek provides powerful insight you won't find in Azure DevOps

Plandekโ€™s ability to track increments of work across your DevOps toolset enables it to provide crucial insight not available in ADO custom reports. Examples include:

Plandekโ€™s ability to track increments of work across your DevOps toolset enables it to provide crucial insight not available in ADO custom reports. Examples include:

๏€Œ

DORA metrics and Flow metrics โ€“ Plandek surfaces these metrics at all levels in your organisation and provides powerful drill-down and related determinant metrics to drive improvement.

๏€Œ

Lead Time to Value โ€“ track and optimise the key Agile metric โ€“ the time taken from design through to delivery to live.

๏€Œ

Ticket Hotspots โ€“ See where work is happening in your repositories to identify areas of code more susceptible to bugs than others.

๏€Œ

Code Knowledge โ€“ Learn how team members interact with other in the pull request process.
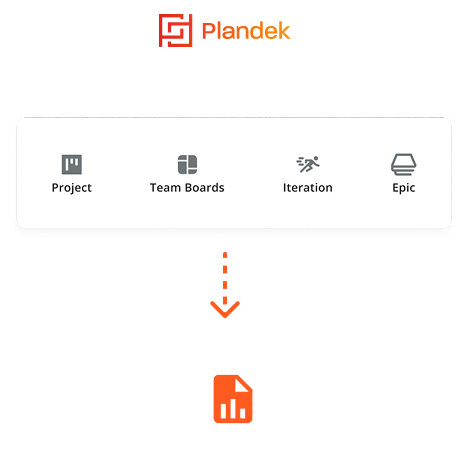
Plandek integration flow diagram showing the Plandek logo connecting to four Azure DevOps data sources โ€” Project, Team Boards, Iteration, and Epic โ€” flowing via a dashed arrow to a single consolidated orange analytics report icon
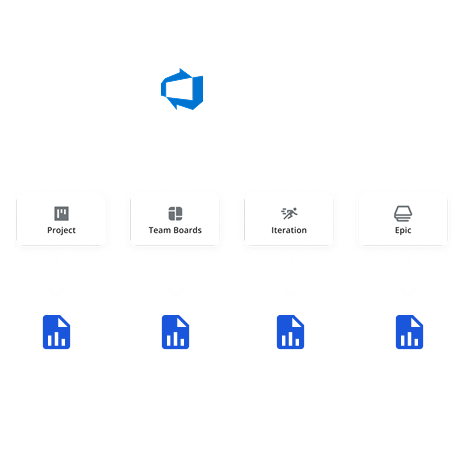
Azure DevOps standalone flow diagram showing the Azure DevOps icon connecting to four data sources โ€” Project, Team Boards, Iteration, and Epic โ€” outputting to four separate blue report document icons, illustrating fragmented reporting without a unified platform

Plandek provides insight at all levels in your organisation

Plandek works across complex organisations allowing you to model the data from all these tools in the way that fits your structure, whereas Azure DevOps silos how you can report.

Align and manage success and challenges across your organisation with a shared view of the SDLC. We understand that every team within an organisation can be different, which is why Plandek offers flexibility at a team level while still maintaining transparency throughout the organisation.

Connect the dots across your toolchain with Plandek
Unlike Azure DevOps, Plandek provides visibility from design to delivery to live by integrating across your toolchain.

This allows team leads to get more insight around the Pull Requests, deployments and builds related to the work that their team is focussing on.

This allows tech leadership to track and drive improvement across the SDLC to accelerate value delivery.

Grid of nine engineering tool integration logos on a white dotted connector background: Azure DevOps, CircleCI, New Relic in the top row, Jira, GitHub, and Jenkins in the middle row, and GitLab, Bitbucket, and PagerDuty in the bottom row

Unlock powerful engineering
insights and spot trends

Unlock powerful engineering insights and spot trends

Overlay engineering metrics with HR, customer and financial data for a new level of insight

Plandek custom time series API enables you to surface multiple data sources and combine them with your SDLC data.

This includes financial, HR and customer data, for example, so you can create DevFinOps metrics and much more.. โ€‹
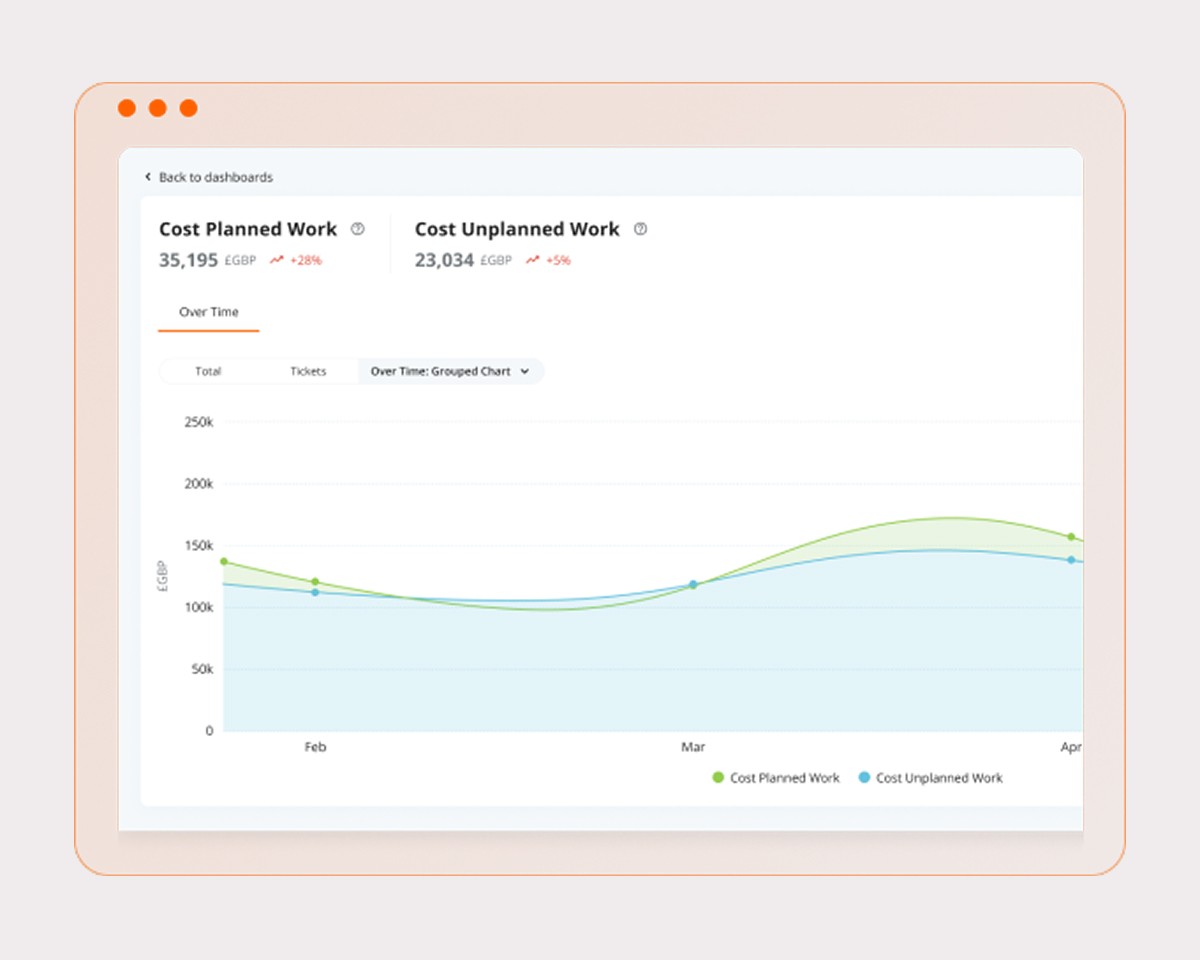
Image showing engineering metrics with HR, customer and financial data
Image showing AI-powered delivery insights

Increase velocity and predictability with SmartView's AI-powered delivery insights

Plandek SmartView analyses the complete ticket history of a team to identify anomalies that require action. Examples include stuck tickets, PR delays, QA issues and many more.

SmartViewโ€™s prescriptive analytics capability provides sprint and epic delivery risk coefficients and identifies mitigation actions for improved forecasting and on-time delivery. โ€‹
Plandek vs Azure DevOps
comparison table

Plandek vs Azure DevOps
comparison table

Azure DevOps app icon โ€” white rounded square with blue origami-style folded arrow logo mark
Azure DevOps
Azure DevOps

๏จ

๏จ

๏จ

๏จ

๏จ

๏จ

๏จ

๏จ

LEGACY TOOL
LEGACY TOOL
LEGACY TOOL

Features

Complete end-to-end analytics across your DevOps toolset

Complete end-to-end analytics across your DevOps toolset

A 'single pane of glass' to surface all the metrics you need to accelerate value delivery - from CIO to Team Lead

A 'single pane of glass' to surface all the metrics you need to accelerate value delivery - from CIO to Team Lead

Highly customisable dashboards and super-configurable metrics for every use case of notification

Highly customisable dashboards and super-configurable metrics for every use case of notification

Surface the widest range of delivery and engineering metrics (including the DORA and Flow metrics)

Surface the widest range of delivery and engineering metrics (including the DORA and Flow metrics)

Stack-agnostic - works across Jira instances, Azure and other DevOps toolsets

Stack-agnostic - works across Jira instances, Azure and other DevOps toolsets

Proprietary SmartView intelligent analytics to identify sprint and epic blockers in real-time and improve forecasting and on-time delivery

Proprietary SmartView intelligent analytics to identify sprint and epic blockers in real-time and improve forecasting and on-time delivery

Ability to ingest multiple data sources (e.g. financial, HR and customer data) to create DevFinOps and other metrics

Ability to ingest multiple data sources (e.g. financial, HR and customer data) to create DevFinOps and other metrics

Customer success resources available to support you in the use of metrics across your organisation

Customer success resources available to support you in the use of metrics across your organisation

Verdict
Plandek app icon โ€” orange rounded square with white interlocked geometric maze logo mark
Plandek
Plandek

๏€Œ

๏€Œ

๏€Œ

๏€Œ

๏€Œ

๏€Œ

๏€Œ

๏€Œ

WINNER
WINNER
WINNER

Trusted by innovative CTOs and engineering leaders globally

Trusted by innovative CTOs and engineering leaders globally

  • If I could take one product with me to a new company, it would be Plandek, and I did that when I joined PEI Group.

    Profile photo of Stuart Pearce, Portfolio CTO at Hg Capital

    Darren Thorpe

    Chief Product Officer, PEI Group

  • Plandek helped us identify the next high-value constraint so we could unlock the next stage of improvement.

    Profile photo of Stuart Pearce, Portfolio CTO at Hg Capital

    Beccy Weeks

    Chief AI Officer, Citation

  • Weโ€™ve been really able to demystify what was once previously a really complex engineering processโ€ฆ

    Profile photo of Stuart Pearce, Portfolio CTO at Hg Capital

    Gary Stevens

    Director of Engineering, Trainline

  • It will become table stakes: if youโ€™re a technology business, you should be able to deliver software in no time at all.

    Profile photo of Stuart Pearce, Portfolio CTO at Hg Capital

    James Cameron-Williams

    CPTO, OAG

  • The data provides a mirrorโ€ฆ it gives us the starting point for the conversations we need to have with our teams.

    Profile photo of Stuart Pearce, Portfolio CTO at Hg Capital

    Niklas Lundborg

    CTO, Bokio

  • Plandek are leaders in this space so we need to tap into this experience.

    Profile photo of Stuart Pearce, Portfolio CTO at Hg Capital

    Daniel Pierce

    Sr Director of Data & Analytics, Sage

See the difference for yourself 

Anyone can show you a dashboard. See what engineering improvement looks like on your own data โ€“ with an expert beside you.

๏€Œ

Insight for every level โ€“ team leads, managers, platform teams, and senior leaders

๏€Œ

Customizable metrics and dashboards built around your workflows

๏€Œ

Expert support to help turn insight into measurable improvement

Book your comparison demo 

See the real difference โ€” on your data, in 20 minutes.