
Turn productivity insight into delivery impact
Benchmark engineering productivity, uncover the delivery constraints slowing teams down, and focus improvement where it will have the greatest impact on speed, quality and business outcomes.
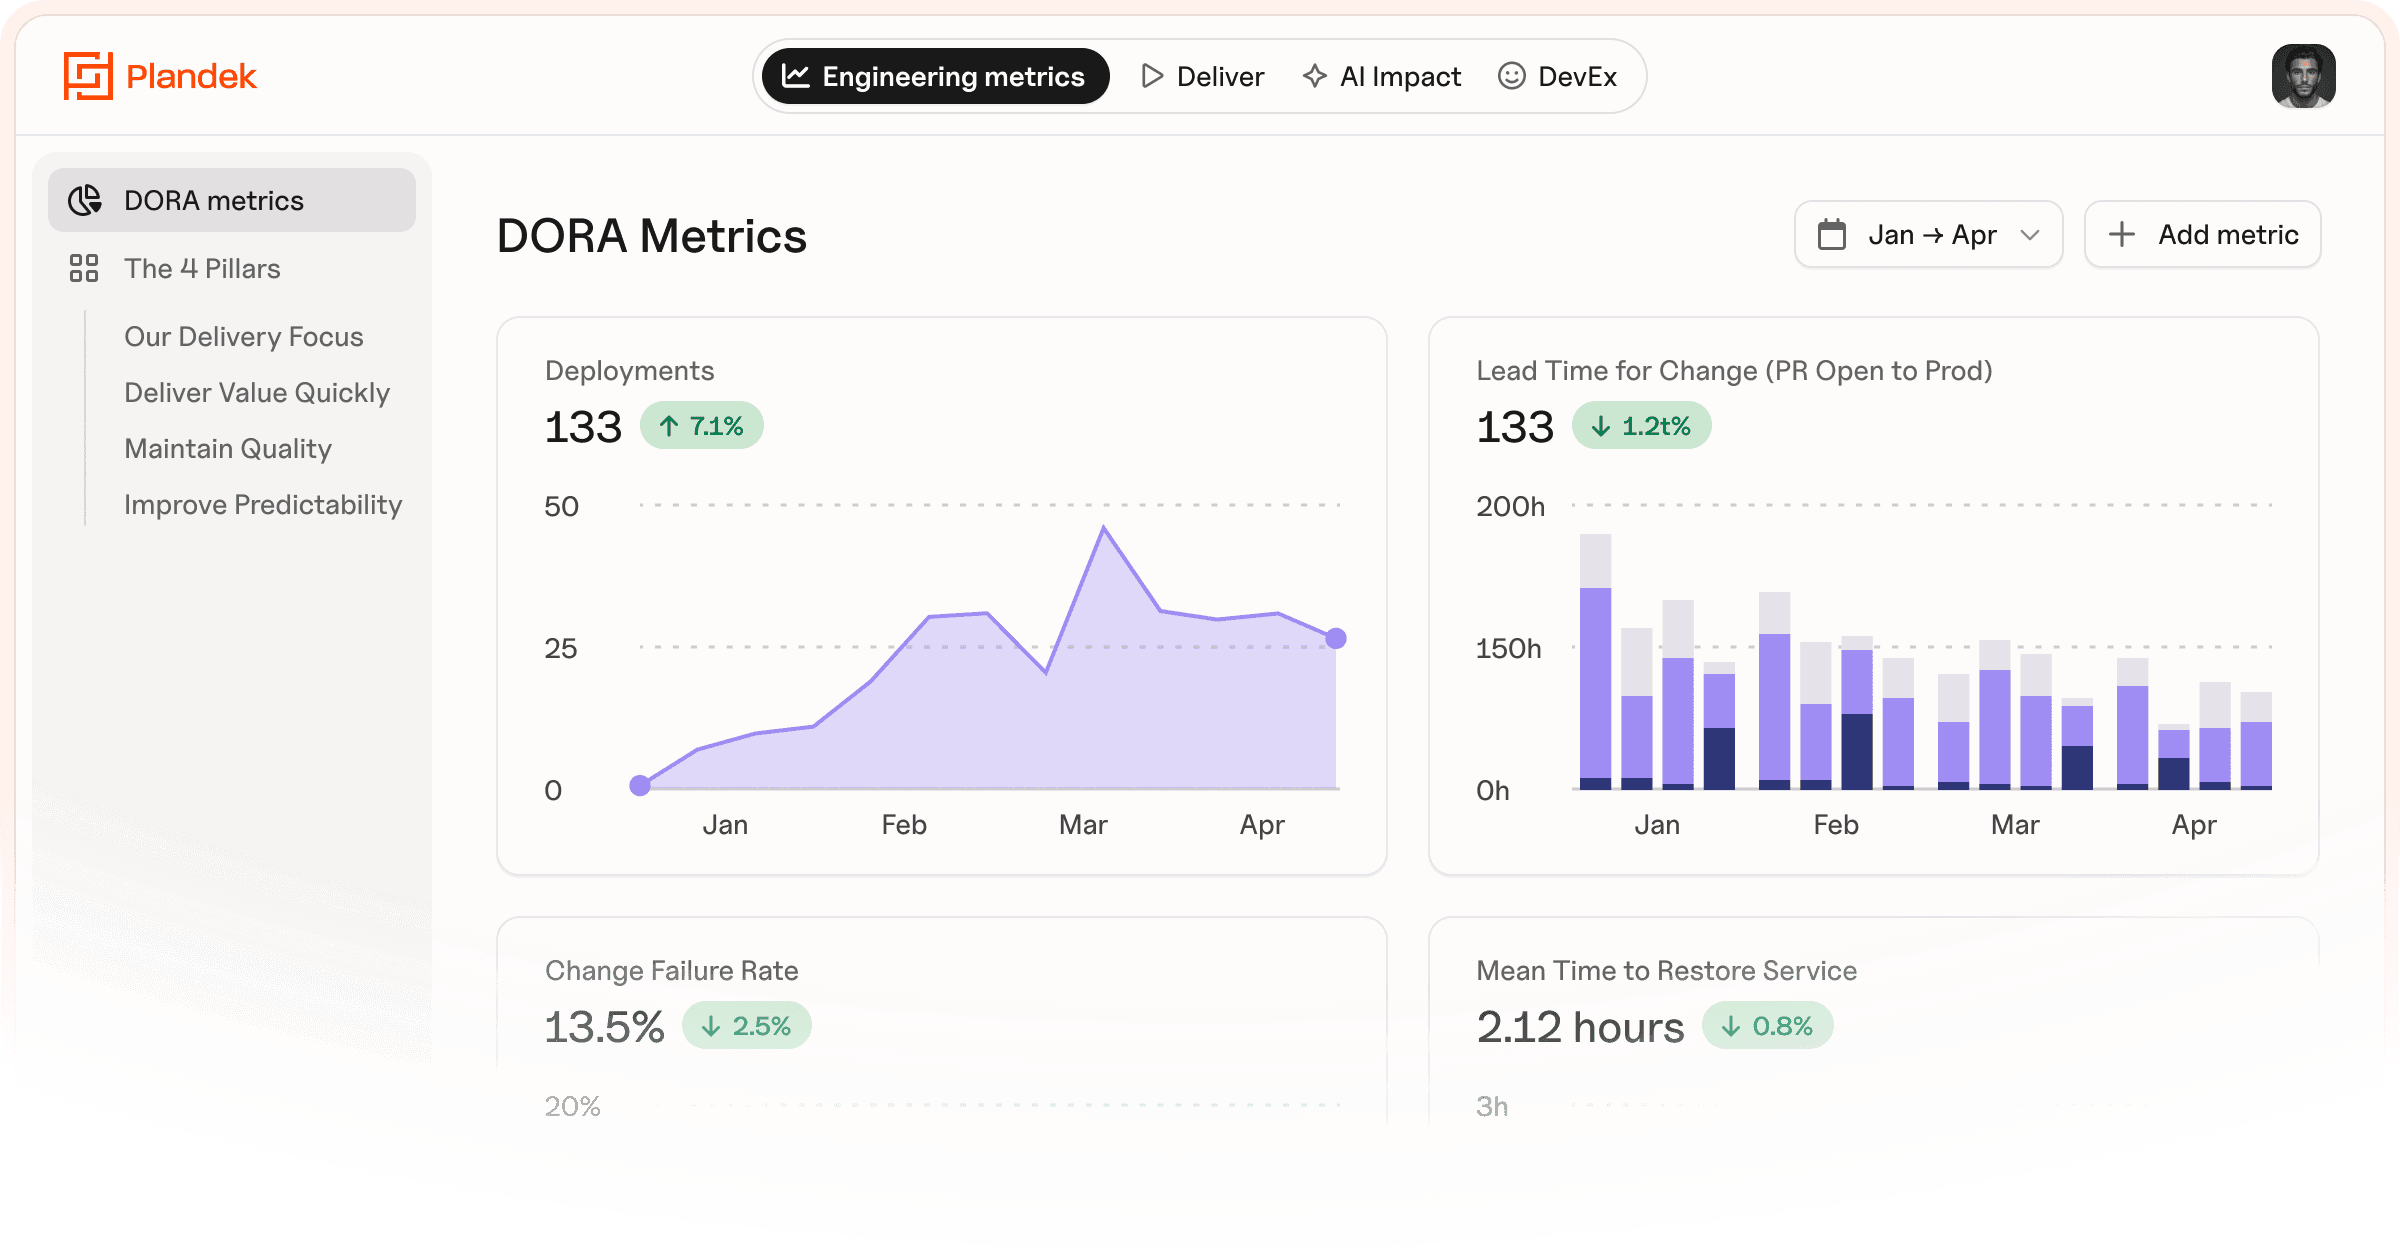
Focus · Speed · Predictability · Quality
Focus · Speed · Predictability · Quality
Improve productivity with Plandek's 4 Pillars framework
Improve productivity with Plandek's 4 Pillars framework
Plandek’s 4 Pillars Framework turns scattered delivery metrics into a practical model for understanding productivity across Focus, Speed, Predictability, and Quality.
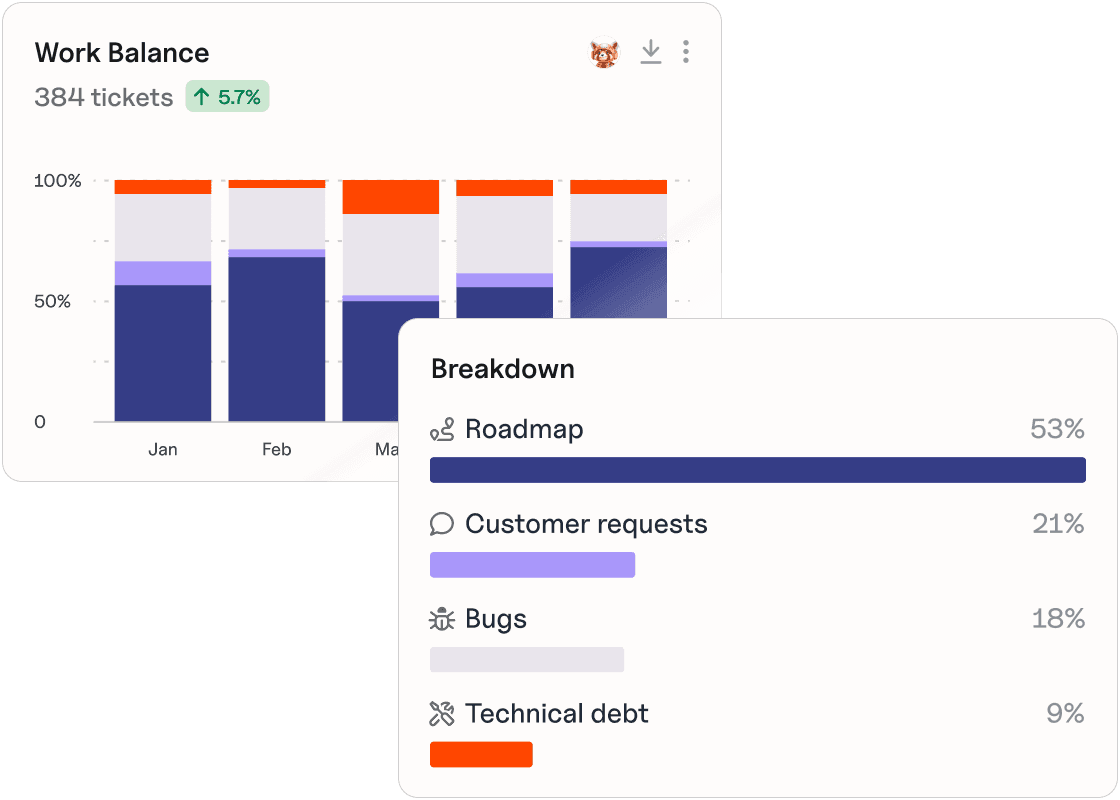
Focus
Are we working on the right things?
See where engineering effort goes, and redirect capacity toward higher-value work.
See where engineering effort goes, and redirect capacity toward higher-value work.
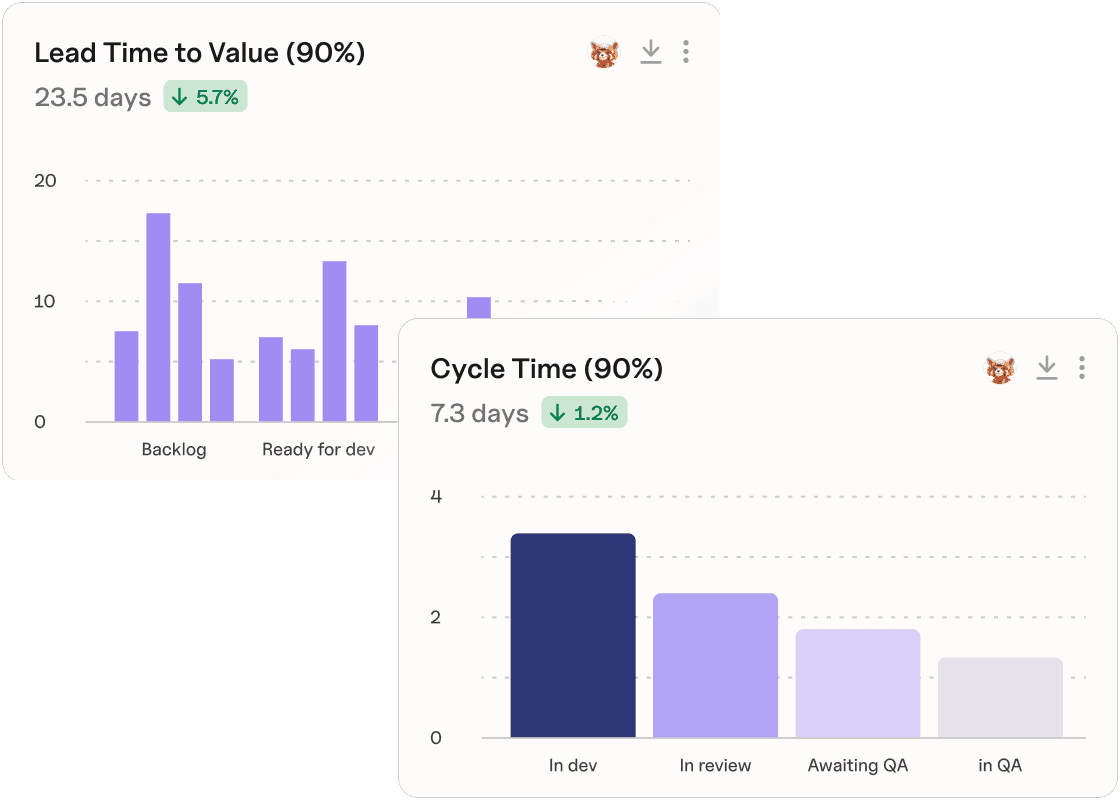
Speed
Are we delivering at the right time
Understand how quickly work moves through the SDLC, and remove delays slowing value delivery.
Understand how quickly work moves through the SDLC, and remove delays slowing value delivery.
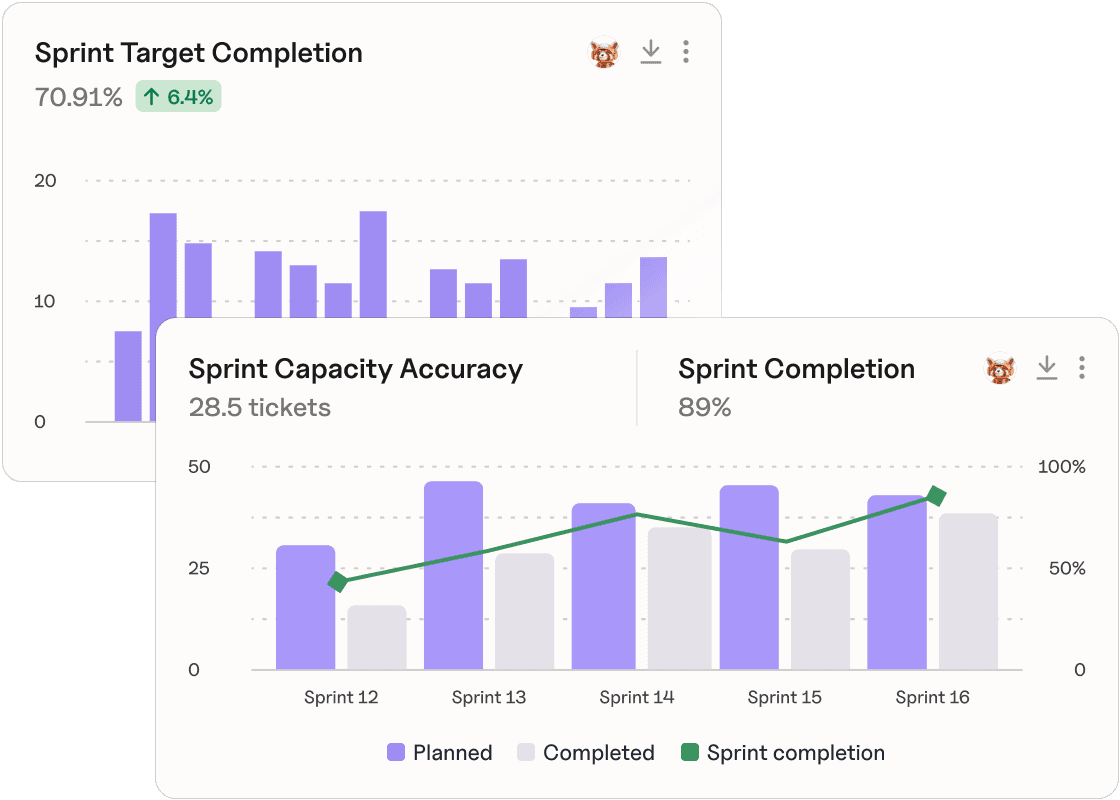
Predictability
How consistently are we delivering?
Spot scope change, volatility, and planning gaps, so teams can make better commitments and reduce delivery surprises.
Spot scope change, volatility, and planning gaps, so teams can make better commitments and reduce delivery surprises.
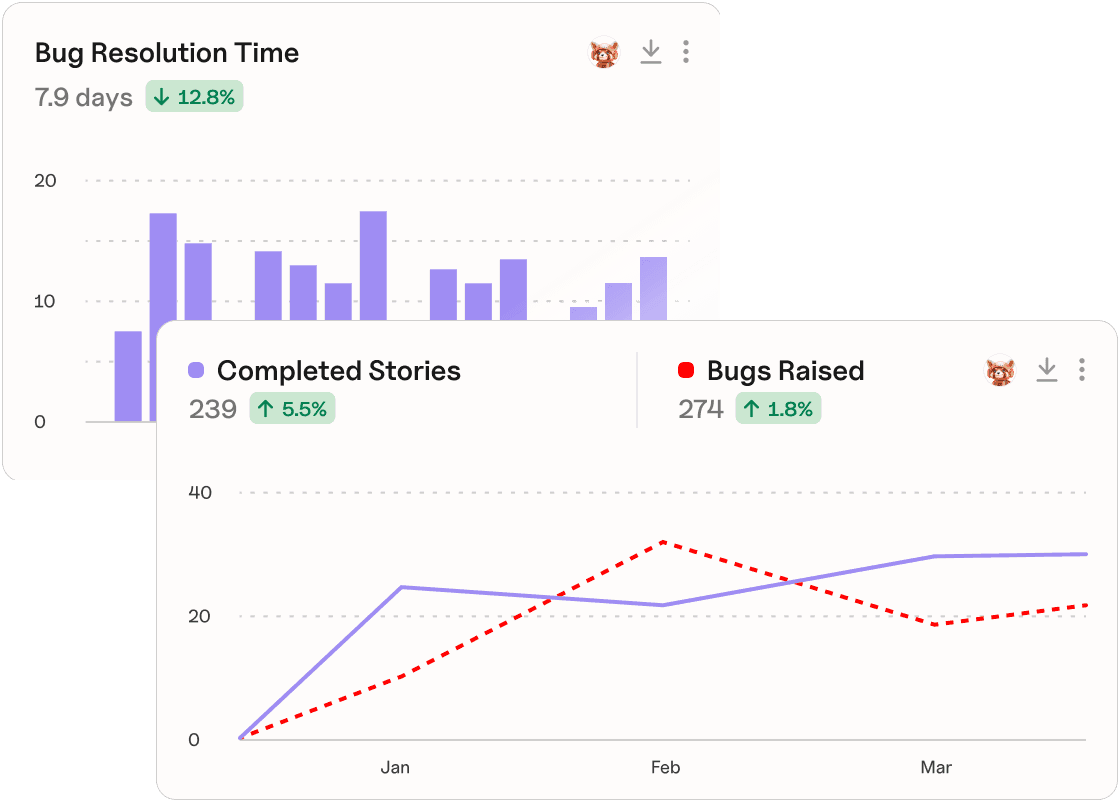
Quality
Are we working in the right way?
Connect defects, rework, and bug resolution to the health of software delivery.
Connect defects, rework, and bug resolution to the health of software delivery.
The 4 Pillars framework brings together engineering metrics that have been proven across thousands of teams.
Start with the right productivity questions
Start with the right productivity questions
Improving productivity starts with understanding what’s really happening inside software delivery. Plandek helps engineering leaders answer the questions that matter most.

How is engineering performing?
Get one benchmarked productivity score that turns scattered delivery signals into a clear view of engineering health – simple enough for leadership, credible enough for deeper investigation.
Get one benchmarked productivity score that turns scattered delivery signals into a clear view of engineering health – simple enough for leadership, credible enough for deeper investigation.
How is engineering performing?
Get one benchmarked productivity score that turns scattered delivery signals into a clear view of engineering health – simple enough for leadership, credible enough for deeper investigation.

Where should we focus next?
Move from score to action. Plandek shows where productivity is being constrained, whether issues are systemic or local, and gives leaders, managers, and teams the context they need to improve it.
Move from score to action. Plandek shows where productivity is being constrained, whether issues are systemic or local, and gives leaders, managers, and teams the context they need to improve it.
Where should we focus next?
Move from score to action. Plandek shows where productivity is being constrained, whether issues are systemic or local, and gives leaders, managers, and teams the context they need to improve it.
Turn productivity insight
into improvement
Turn productivity insight into improvement
Understand productivity in context
See productivity across your whole system
Connect messy data across tools, teams, workflows, and metrics. Use Plandek’s 4 Pillars, DORA metrics, Flow metrics, or fully custom dashboards to measure productivity your way.
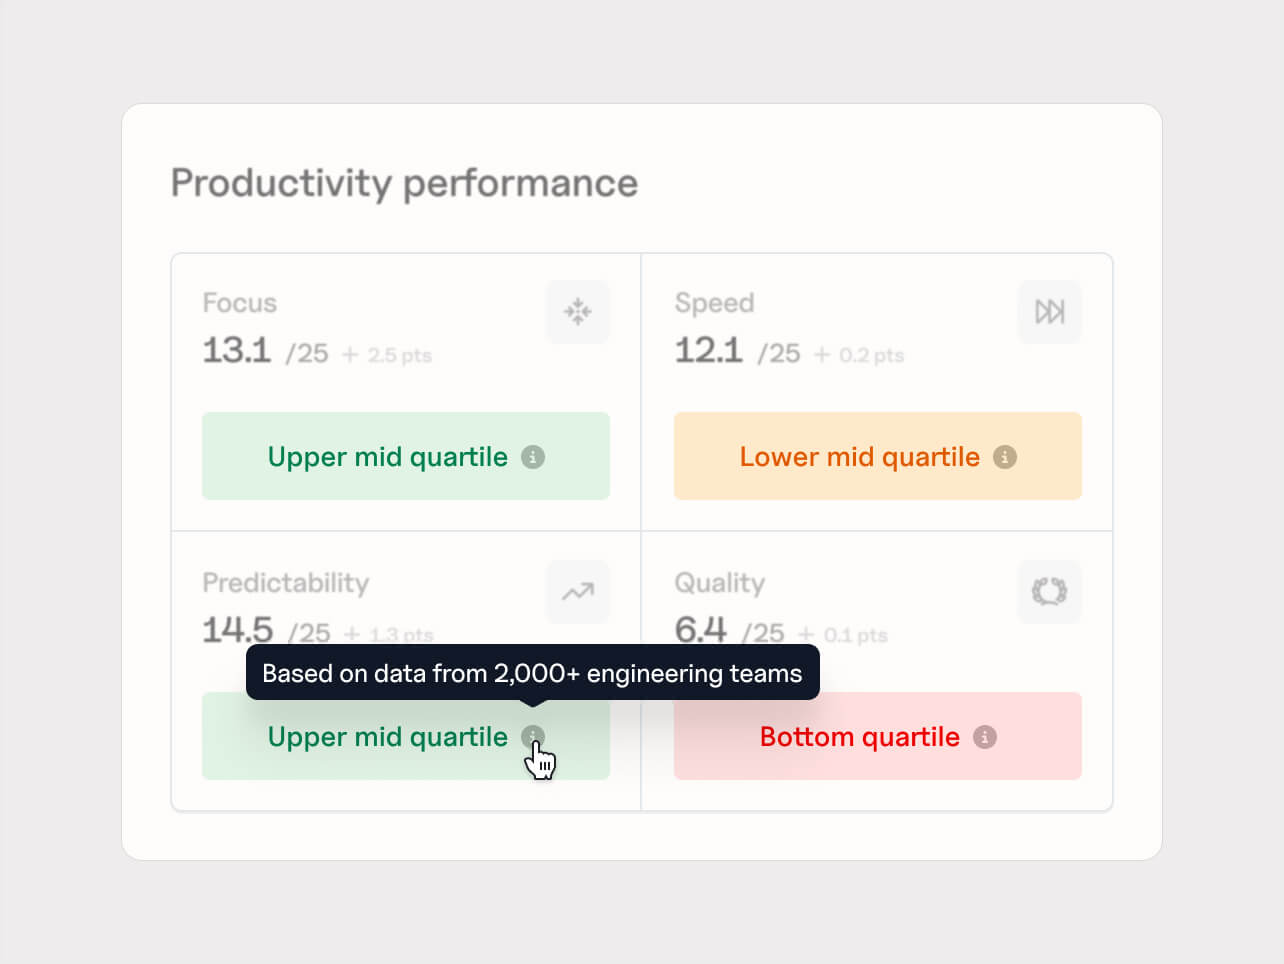
Benchmark performance. Know what matters.
Benchmark productivity at every level of your organization against 2,000+ engineering teams, and surface the scores, trends, and gaps that need action.
Understand productivity in context
See productivity across your whole system
Connect messy data across tools, teams, workflows, and metrics. Use Plandek’s 4 Pillars, DORA metrics, Flow metrics, or fully custom dashboards to measure productivity your way.
Benchmark performance. Know what matters.
Benchmark productivity at every level of your organization against 2,000+ engineering teams, and surface the scores, trends, and gaps that need action.
Turn insight into action
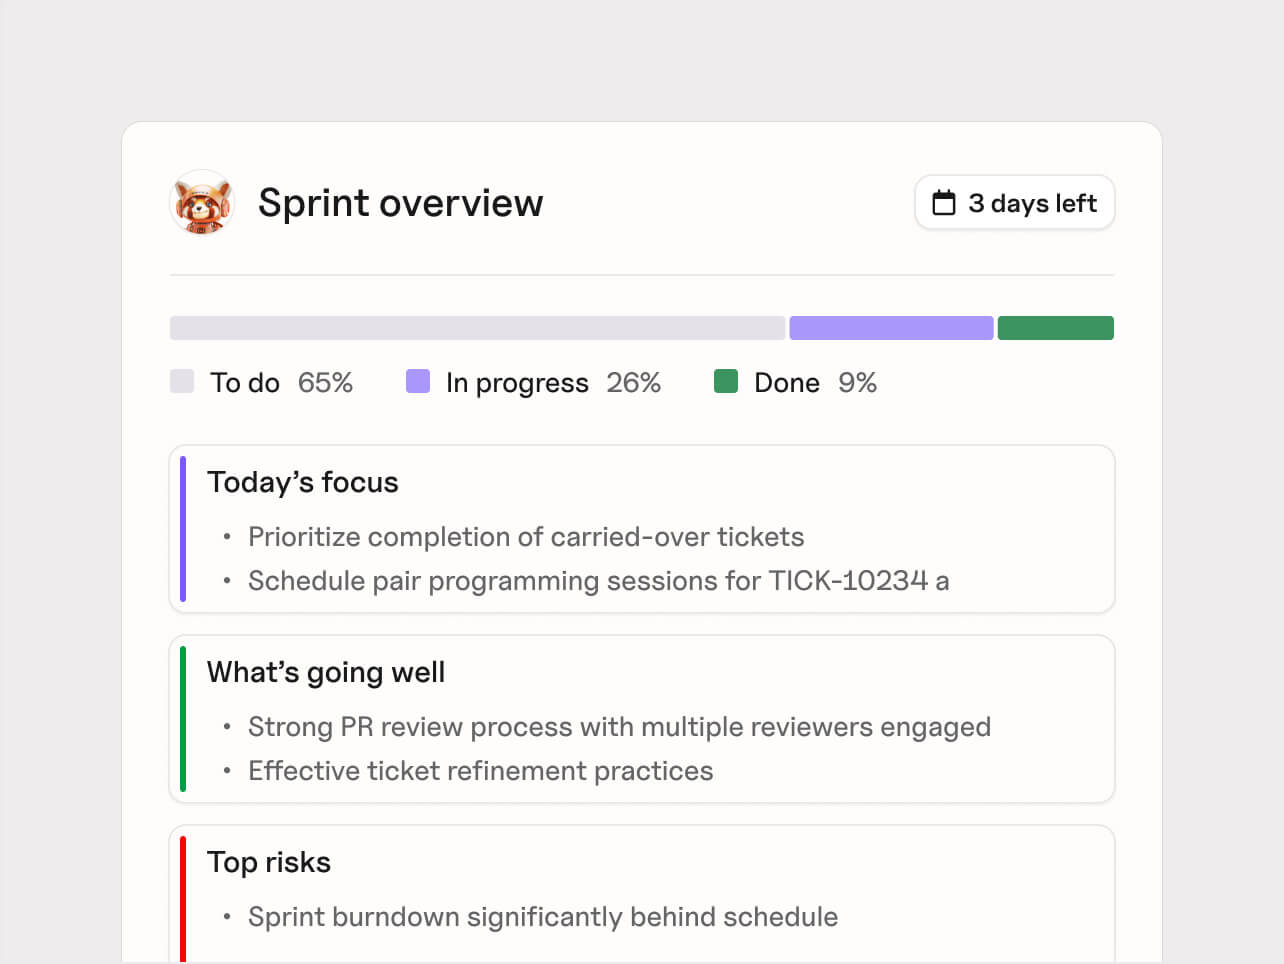
Diagnose the constraints behind the score
Plandek surfaces productivity gaps, across Focus, Speed, Predictability, and Quality, then helps you investigate the likely causes across teams, workflows, trends, and categories.
Combine delivery data with engineer feedback
Pair delivery metrics with engineer surveys to understand why productivity issues exist – from unclear requirements and review bottlenecks to developer experience friction and AI adoption challenges.
Turn insight into action
Diagnose the constraints behind the score
Plandek surfaces productivity gaps, across Focus, Speed, Predictability, and Quality, then helps you investigate the likely causes across teams, workflows, trends, and categories.
Combine delivery data with engineer feedback
Pair delivery metrics with engineer surveys to understand why productivity issues exist – from unclear requirements and review bottlenecks to developer experience friction and AI adoption challenges.

Make AI a driver of productivity
Assess readiness for agentic AI
Scan repositories for AI readiness, and identify where context, controls, or delivery constraints could limit productivity gains or create risk before AI engineering scales.
Measure AI as a productivity lever
Track AI adoption, activation, usage patterns, spend, review burden, and cost per AI output to understand whether AI is improving delivery.
Make AI a driver of productivity
Assess readiness for agentic AI
Scan repositories for AI readiness, and identify where context, controls, or delivery constraints could limit productivity gains or create risk before AI engineering scales.
Measure AI as a productivity lever
Track AI adoption, activation, usage patterns, spend, review burden, and cost per AI output to understand whether AI is improving delivery.

If you want to know if engineering is running efficiently, Plandek gives you the complete picture. If I could take one product with me to a new company, it would be Plandek, and I did that when I joined PEI Group.
If you want to know if engineering is running efficiently, Plandek gives you the complete picture. If I could take one product with me to a new company, it would be Plandek, and I did that when I joined PEI Group.

Darren Thorpe
Darren Thorpe
Chief Product Officer, PEI Group
Chief Product Officer, PEI Group

The data provides a mirror. It’s not just showing us where the problems are, it gives us the starting point for the conversations we need to have with our teams.
The data provides a mirror. It’s not just showing us where the problems are, it gives us the starting point for the conversations we need to have with our teams.

Niklas Lundborg
Niklas Lundborg
CTO, Bokio
CTO, Bokio

We’ve been really able to demystify what was once previously a really complex engineering process… and really build a better conversation around what it means to build good product software.
We’ve been really able to demystify what was once previously a really complex engineering process… and really build a better conversation around what it means to build good product software.

Gary Stevens
Gary Stevens
Director of Engineering, Trainline
Director of Engineering, Trainline

As we accelerated with AI, we’d see productivity improve, then plateau. Plandek helped us identify the next high-value constraint so we could unlock the next stage of improvement.
As we accelerated with AI, we’d see productivity improve, then plateau. Plandek helped us identify the next high-value constraint so we could unlock the next stage of improvement.

Beccy Weeks
Beccy Weeks
Chief AI Officer, Citation
Chief AI Officer, Citation

Metrics are like those red markers. They track our progress, help us adapt to challenges, and drive team improvement.
Metrics are like those red markers. They track our progress, help us adapt to challenges, and drive team improvement.

Sergey Völker
Sergey Völker
Senior Agile Coach, Lucanet
Senior Agile Coach, Lucanet
Plandek was a great fit for us culturally. We wanted a tool that made engineers feel that it was there to help them with problems rather than feel like it was measuring them as individuals.
Plandek was a great fit for us culturally. We wanted a tool that made engineers feel that it was there to help them with problems rather than feel like it was measuring them as individuals.
Gary Stevens
Gary Stevens
Director of Engineering, Trainline
Director of Engineering, Trainline
Ready to build a higher-performing delivery system?
Turn productivity insight into faster delivery, fewer surprises, higher-quality releases, and stronger ROI from every engineering investment.












Platform
Platform
Contact us
UK Office
Unit 313 The Print Rooms, 164-180
Union St, London SE1 0LH
US Office
Floor 4, 1515 Mockingbird Ln,
Charlotte, NC 28209, USA