




















Plandek for Engineering Managers

Plandek for Engineering Managers

Understand how work really flows across your P-SDLC, remove the bottlenecks slowing delivery, and help your teams transition safely toward AI-augmented and agentic ways of working.

Understand how work really flows across your P-SDLC, remove the bottlenecks slowing delivery, and help your teams transition safely toward AI-augmented and agentic ways of working.

Smiling woman with short curly hair and round glasses, arms crossed, wearing a denim jacket over a grey turtleneck, standing in front of a grey wall with colourful sticky notes and Edison bulbs — representing an engineering manager

Understand team
performance and flow

Understand team performance and flow

Get the visibility you need to compare team performance, spot bottlenecks, and focus improvement where it matters.

Plandek Engineering Productivity Score gauge showing a score of 68, rated above benchmark versus 2k+ teams, with colour-coded arc segments from 0 to 100, plus callout chips showing 8 metrics improving, 1 area to review, and plus 6 versus last quarter

Benchmark with confidence

Compare performance against 2,000+ engineering teams using transparent, quartile-based benchmarks across Focus, Speed, Predictability, and Quality.

Compare performance against 2,000+ engineering teams using transparent, quartile-based benchmarks across Focus, Speed, Predictability, and Quality.

Plandek Engineering Productivity Score gauge showing a score of 68, rated above benchmark versus 2k+ teams, with colour-coded arc segments from 0 to 100, plus callout chips showing 8 metrics improving, 1 area to review, and plus 6 versus last quarter

Benchmark with confidence

Compare performance against 2,000+ engineering teams using transparent, quartile-based benchmarks across Focus, Speed, Predictability, and Quality.

Plandek Teams dashboard on the Teams tab showing team performance summary: 3 Need attention, 2 Below average, 11 Above average, 2 Top performers, with a bottom 25% breakdown listing Retail Cloud 32%, Finance Suite 20%, and Public Sector Cloud 18% needing attention

An X-ray through your SDLC

Drill into workflows, handoffs, review cycles, and delivery patterns to see where process issues are limiting productivity.

Drill into workflows, handoffs, review cycles, and delivery patterns to see where process issues are limiting productivity.

Plandek Teams dashboard on the Teams tab showing team performance summary: 3 Need attention, 2 Below average, 11 Above average, 2 Top performers, with a bottom 25% breakdown listing Retail Cloud 32%, Finance Suite 20%, and Public Sector Cloud 18% needing attention

An X-ray through your SDLC

Drill into workflows, handoffs, review cycles, and delivery patterns to see where process issues are limiting productivity.

Scale AI safely across your teams

Get the insights you need to enable AI to create value.

Plandek integration diagram showing engineering tools including GitHub, GitLab, Jira, CircleCI, and AI tools feeding data into the Plandek platform
Create the harness for
safe agentic delivery

Scan your repositories for agentic AI readiness. Know where context, controls or constraints pose risks or limit the potential of AI before scaling usage.

Scan your repositories for agentic AI readiness. Know where context, controls or constraints pose risks or limit the potential of AI before scaling usage.

Plandek integration diagram showing engineering tools including GitHub, GitLab, Jira, CircleCI, and AI tools feeding data into the Plandek platform
Create the harness for safe agentic delivery

Scan your repositories for agentic AI readiness. Know where context, controls or constraints pose risks or limit the potential of AI before scaling usage.

Plandek AI Adoption Progress dashboard showing daily activity rate 34% up 7.1%, daily license utilization 33% up 1.4%, and 5 daily multi-tool users, with license breakdown for Claude Code, Cursor, GitHub Copilot, and Devin, plus multi-tool usage distribution chart
Track AI adoption patterns

Compare coverage and activation across tools and teams, and understand which usage patterns are becoming productive, and where successful practices can be shared to improve performance.

Compare coverage and activation across tools and teams, and understand which usage patterns are becoming productive, and where successful practices can be shared to improve performance.

Plandek AI Adoption Progress dashboard showing daily activity rate 34% up 7.1%, daily license utilization 33% up 1.4%, and 5 daily multi-tool users, with license breakdown for Claude Code, Cursor, GitHub Copilot, and Devin, plus multi-tool usage distribution chart
Track AI adoption patterns

Compare coverage and activation across tools and teams, and understand which usage patterns are becoming productive, and where successful practices can be shared to improve performance.

Help teams act and keep improving

Give teams the insight, feedback, and next actions they need to improve delivery.
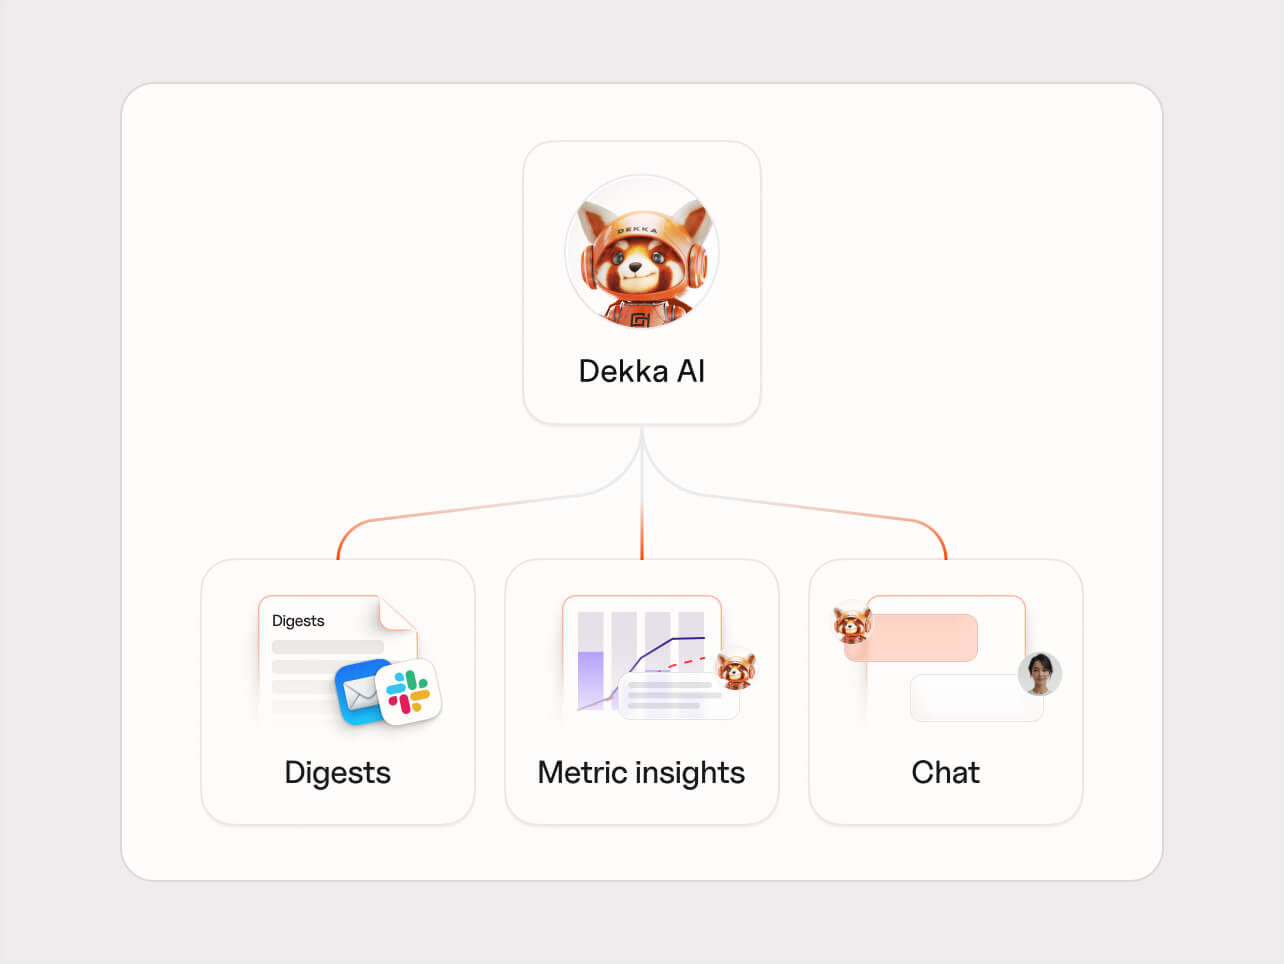
Dekka AI capability diagram showing the Dekka AI mascot at the top branching into three delivery modes: Digests delivered via email and Slack, Metric insights shown on a chart, and Chat for conversational engineering queries
Your AI engineering assistant, Dekka

Dekka is the proactive AI tool for Scrum Masters and Team Leads, answering questions other AI can’t, and briefing you and your team on hidden risks, blockers, and the next best actions.

Dekka is the proactive AI tool for Scrum Masters and Team Leads, answering questions other AI can’t, and briefing you and your team on hidden risks, blockers, and the next best actions.

Dekka AI capability diagram showing the Dekka AI mascot at the top branching into three delivery modes: Digests delivered via email and Slack, Metric insights shown on a chart, and Chat for conversational engineering queries
Your AI engineering assistant, Dekka

Dekka is the proactive AI tool for Scrum Masters and Team Leads, answering questions other AI can’t, and briefing you and your team on hidden risks, blockers, and the next best actions.

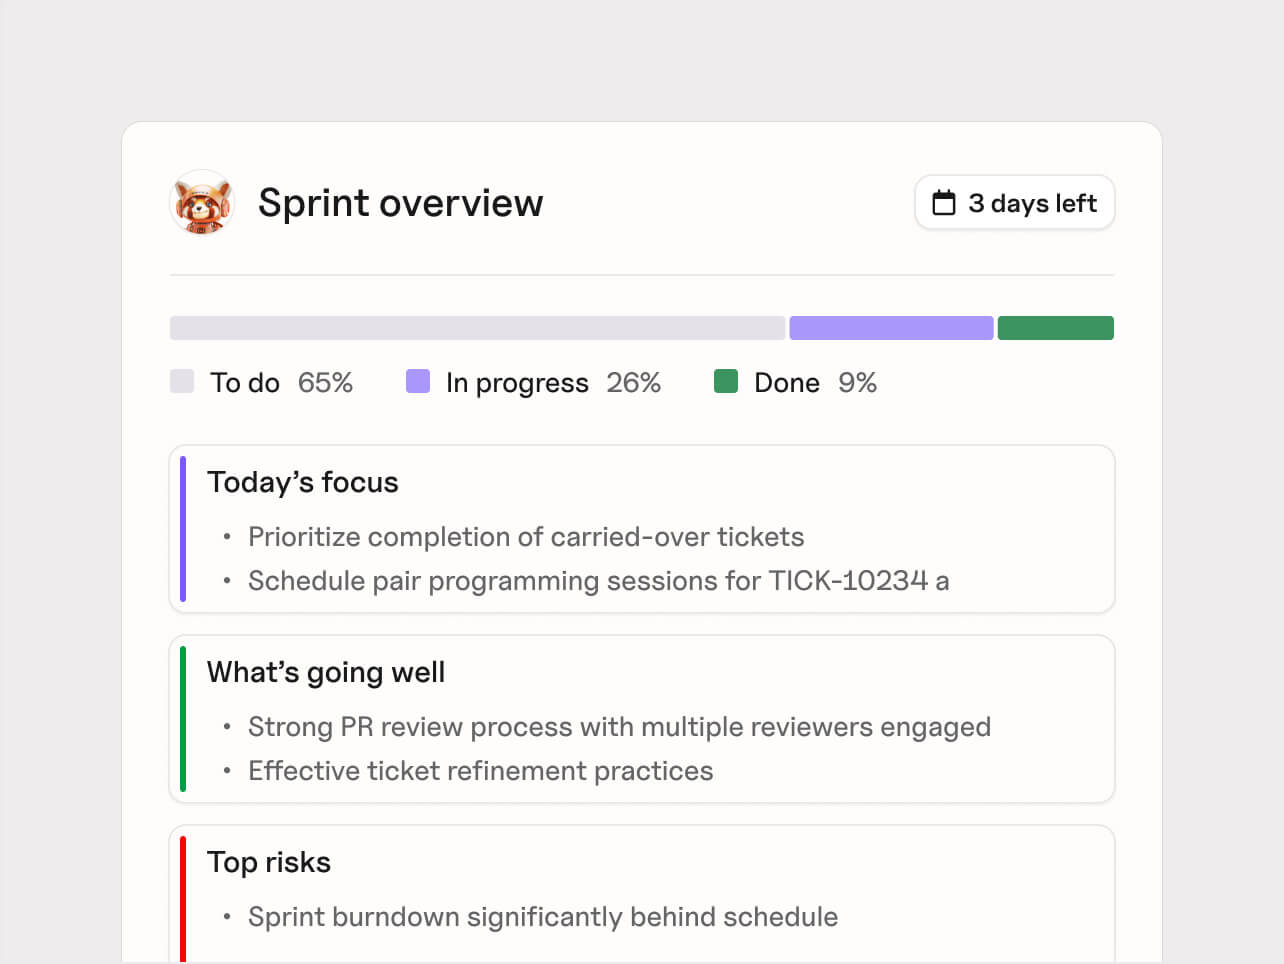
Plandek Sprint overview card showing 3 days left, sprint progress breakdown of To do 65%, In progress 26%, Done 9%, with Dekka AI sections for Today's focus, What's going well, and Top risks including sprint burndown behind schedule
Turn engineer feedback into action

Combine delivery data with engineer feedback to understand what helps teams do their best work, and create the conditions for happier engineers and better software delivery outcomes.

Combine delivery data with engineer feedback to understand what helps teams do their best work, and create the conditions for happier engineers and better software delivery outcomes.

Plandek Sprint overview card showing 3 days left, sprint progress breakdown of To do 65%, In progress 26%, Done 9%, with Dekka AI sections for Today's focus, What's going well, and Top risks including sprint burndown behind schedule
Turn engineer feedback into action

Combine delivery data with engineer feedback to understand what helps teams do their best work, and create the conditions for happier engineers and better software delivery outcomes.

Real impact for real customers

See how engineering organisations use Plandek to improve productivity, delivery performance, and engineering outcomes.

Professional headshot of a bald man with a short beard wearing a dark blazer and striped shirt in front of a blurred indoor background

Frank Amiet

CTO, Eudonet

Since implementing Plandek, we have tracked delivery with greater accuracy across our development tools, from progress tracking to code activity.

Profile photo of Eirik Petterson, CTO at Secret Escapes, smiling man with short dark hair and stubble wearing a light blazer

Erik Peterson

CTO, Secret Escapes

Plandek is already making an important contribution to our collection of metrics, helping us understand delivery at scale.

Profile photo of Giulio Folino, Head of Digital at Ministry of Justice, smiling man with a beard outdoors with mountains and a lake visible behind him

Giulio Folino

Head of Digital, MoJ

Plandek has enabled us to focus our organisation on the delivery behaviours that drive the right outcomes.