
























Show boards what is improving, with benchmarked evidence
Find the constraints limiting company performance
Prove whether Product and R&D spend is creating value
1

One benchmarked productivity score
Give portfolio CTOs a single, transparent score that shows how product and engineering is performing.
Four pillars of productivity
Measure product and engineering health across Focus, Speed, Predictability, and Quality.
Benchmark against 2,000+ teams
Understand where an organization is ahead, behind, or improving with quartile-based benchmarks against their own performance and against other companies.
Focus the value creation plan
Identify the productivity gaps constraining R&D ROI, so CTOs can focus on the next improvement priority.
2

A complete view of software delivery
Use our powerful constraint investigation features to see where engineering bottlenecks affect delivery.
Prioritize what unlocks ROI
Focus investment on the constraints most likely to improve software delivery outcomes.
Assess readiness for agentic AI
Scan the codebase for AI readiness, and identify where context, controls, or delivery constraints pose limitations or risks.
Scale the practices that work
Compare adoption and activation across teams and tools to understand where AI is delivering results.
3

Find where action is needed, and prioritize
Drill into teams, workspaces, and categories to see where productivity gaps are systemic, concentrated, or already improving.
Equip managers to improve performance
Give engineering managers benchmarked metrics, trend data, and delivery signals to focus team improvement.
Support better team conversations
Use granular delivery context and engineer feedback to help teams discuss progress, blockers, and ways to improve.
Improve quarter by quarter
Track productivity movement over time, so leaders can see whether changes are improving delivery performance and R&D ROI.
4

Connect AI investment to value creation
Track whether R&D and AI spend is creating measurable gains in software engineering productivity.
Break down the cost behind the output
See tool spend, review burden, human cost, and cost per AI output, so CTOs can manage spend with confidence.
Find where spend is not converting
Always know where investment is creating waste, friction, or limited return.
Give boards an independent view
Plandek’s semi-annual Health Checks combine data with expert analysis from our Agile & AI Transition experts to provide board-ready recommendations.
Drive productivity across the value creation journey
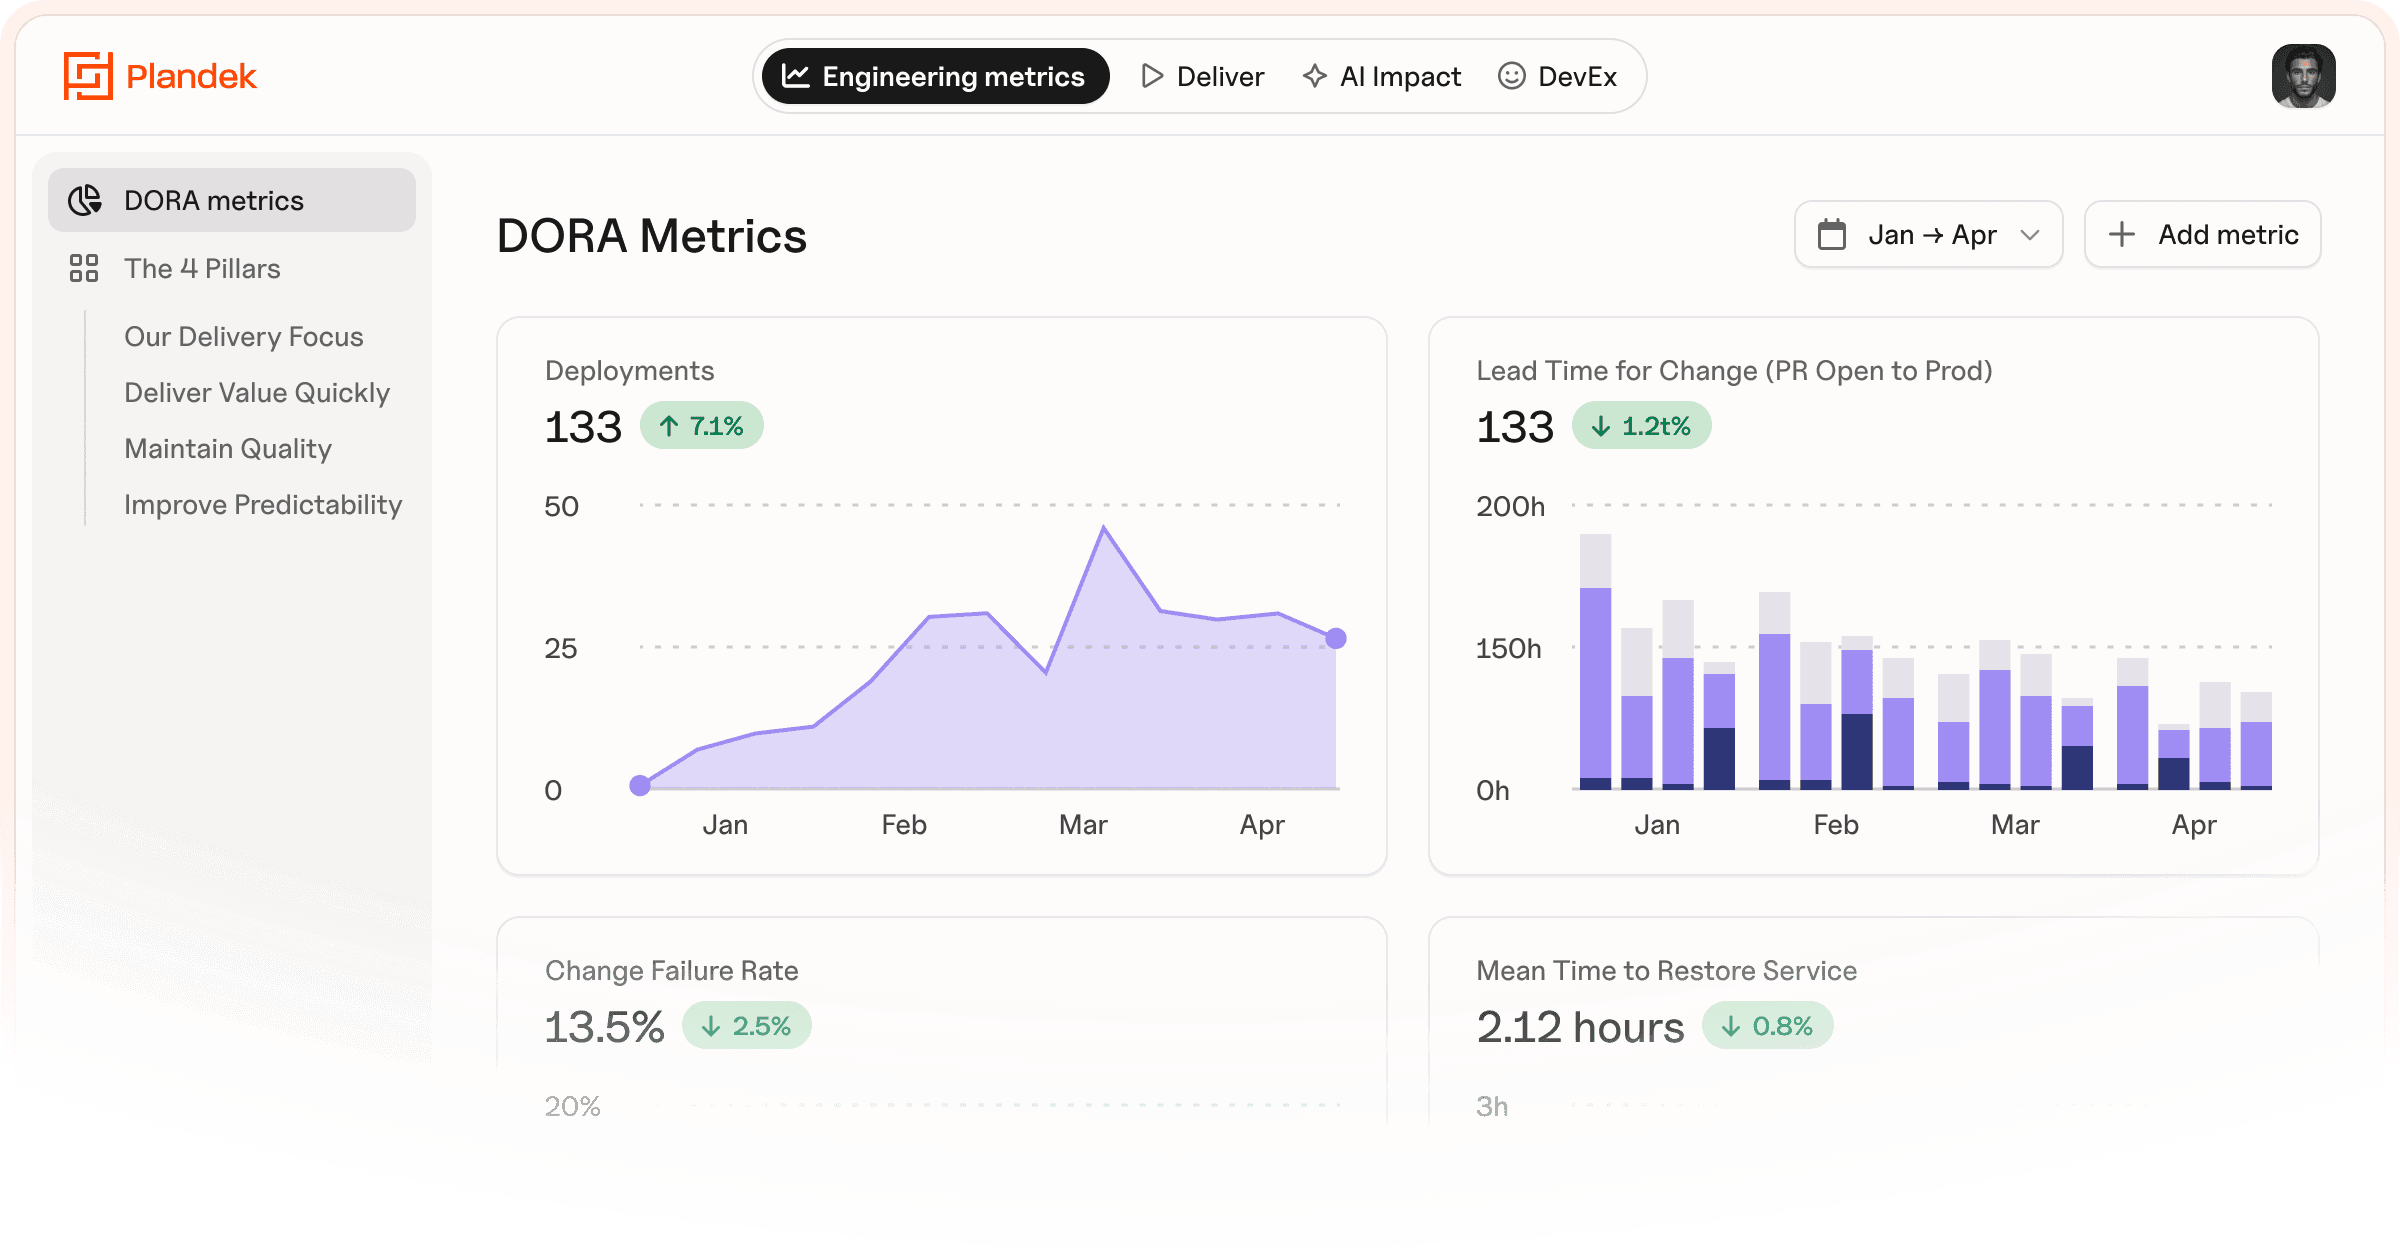
Value creation planning
Build a benchmarked view of engineering productivity, delivery constraints, and improvement opportunities before deciding where to invest.
Value delivery
Enable portfolio company CTOs to focus teams on the changes most likely to improve throughput, predictability, quality, and time-to-market.
Board-ready proof
Track productivity trends, benchmark performance, and use independent Health Checks to show progress, risks, and R&D ROI over time.




Top Global
Developer Productivity Insight Platform
Gartner’s 2025 market guide
Top Global
Software Engineering Intelligence Platform
Gartner’s 2024 market guide














Ready to accelerate value creation across your portfolio?
Enable portfolio company CTOs to benchmark engineering productivity, identify delivery constraints and prove R&D ROI with confidence.











NEW
NEW
Contact us
UK Office
Unit 313 The Print Rooms, 164-180
Union St, London SE1 0LH
US Office
Floor 4, 1515 Mockingbird Ln,
Charlotte, NC 28209, USA