
How to measure and reduce Agile risk

You’ve probably been there – everything seems healthy, tickets are moving, pull requests are merging; but deadlines still slip along with scope, perhaps quality drops, and technical debt rises.
When this happens, risk wasn’t visible early enough to act on. If you want to reduce Agile delivery risk, you need to measure it where it emerges: in the flow of work itself.
If you want to improve Agile risk management, you need to measure it where it emerges: in the flow of work itself
In this article:
How does Agile reduce risk?
How to measure Agile risk in software engineering?
What Agile risk metrics should we use?
How do we turn risk signals into an Agile risk score?
How do we reduce risk in Agile software development?
What is risk in Agile software development?
Risk in Agile software development is any condition that could make delivery less predictable, reduce quality, delay value, or increase rework. In practice, it often appears as delivery friction: work slowing down, scope changing, defects rising, or teams losing confidence in what will land and when.
Does Agile reduce risk?
Agile reduces risk by shortening feedback loops, exposing assumptions earlier, and giving teams regular opportunities to inspect and adapt. It is especially useful for reducing the risk of late discovery, but teams still need to measure delivery risk as work moves through the system.
Instead of one big failure at the end, you start to see smaller signals earlier on:
PRs sitting in review longer than they should
tickets in progress with no commits
scope creeping in halfway through a sprint
work rolling over… again
bugs creeping up while output still looks fine
epics that quietly stop lining up with the plan
When these start happening frequently, we begin to struggle. Your team probably has a risk register – but this tends to reflect what people think might go wrong, as opposed to what is really a risk.
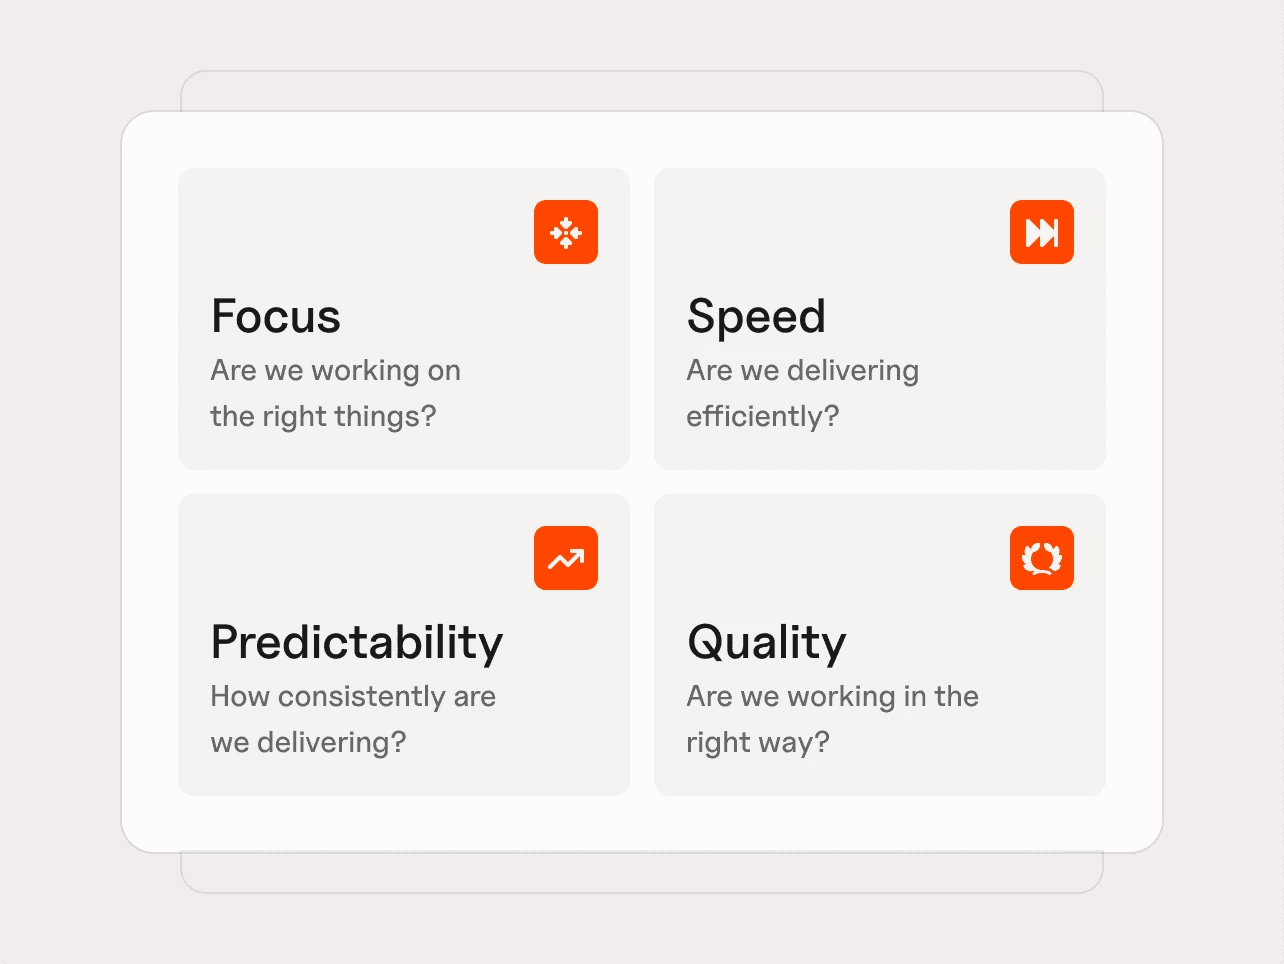
At Plandek, we think about engineering productivity through four connected pillars: Focus, Speed, Predictability and Quality. These pillars show how the delivery system is performing.
This is The Four Pillars of Productivity Framework.
Risk is what happens when those pillars start to weaken. It is the signal that performance is starting to become unstable.
The core of risk management in software development is understanding risk as it forms, not just documenting it.
Put simply:
Productivity metrics show whether the system is performing well. Risk signals show where it is beginning to break down.
The Four Pillars: where Agile risk starts to appear
The Four Pillars of Engineering Productivity are a practical framework to help you understand your software delivery performance. Each pillar – Focus, Speed, Predictability and Quality – contains a focused set of software development productivity metrics that show whether your teams are working on the right things, moving work efficiently, delivering reliably and maintaining quality under pressure.
Used together, they will give you a balanced view of engineering performance, and a clearer way to spot where delivery risk is starting to build.
Focus risk: are you actually working on the right things?
If your team is spending less time on roadmap work and more time on support, bugs, or “just one quick thing”, your plan is already out of date.
Track:
Value Delivery %
Support and Maintenance %
If those start drifting, risk is already in the system.
You’ll usually see it alongside distractions, or work happening outside the sprint or epic, and that’s your early warning that planned capacity isn’t real capacity.
Speed risk: is work actually flowing?
Speed risk is all about whether work is moving cleanly through the system.
Track:
Lead Time to Value
Cycle Time
Time to Merge PRs
Throughput Quotient
PR Efficiency Quotient
Merge Frequency
When these degrade, something is slowing you down. You might, for instance, want to take a look at
Delayed PRs
Tickets stuck in status
Tickets without commits
You’ve seen this before – nothing looks “blocked”, but everything is just… slower. We should understand this as risk building in queues
Delivery predictability risk: can you trust your plan?
You don’t need perfect plans, but you do need plans you can trust.
According to Plandek’s 2026 Engineering Productivity Benchmarks, top quartile teams complete over 68% of planned sprint work, while bottom quartile teams complete less than 48%. The difference is strongly linked to scope stability: bottom quartile teams experience more than double the rate of mid-sprint scope change.
Track:
Sprint Capacity Accuracy
Sprint Target Completion
Mid-Sprint Scope Change %
Velocity Volatility
If these move around too much, you’ve lost delivery confidence. The signals tell you why:
Scope changing mid-sprint
Work being added without trade-offs
Carryover becoming normal
Epics quietly drifting
This is where sprint risk becomes visible as a pattern of missed or shifting commitments. Leaders usually feel risk here first, not because something broke, but because they can’t get a straight answer on what’s going to land.
Quality risk: are you creating future problems?
Track:
Bug Resolution Time
Stories : Bugs ratio
If bugs are rising, or taking longer to resolve, you’re creating rework that you don’t want. Technical debt is one of the biggest causes of low team morale, and once it begins to compound, it’s easy to get stuck in that loop.
Now, not all technical debt is bad technical debt. Martin Fowler asks us to consider whether taking tech debt is prudent, and whether it is deliberate, as Alex Omeyer explains in this helpful explainer on tech debt in Agile.
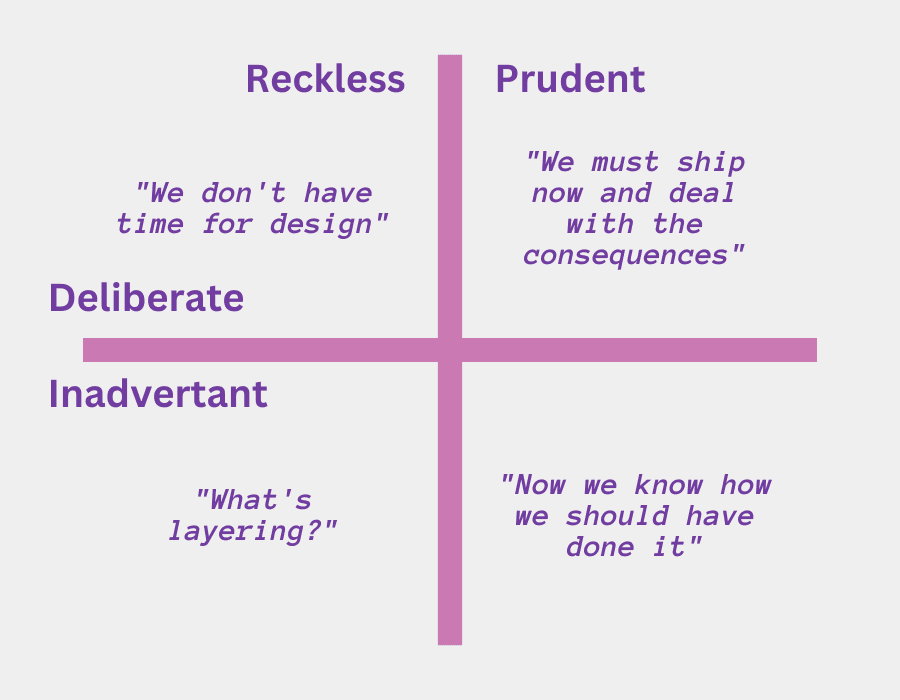
The principle here is to be cognizant of borrowing from the future. Sometimes the benefit of shipping faster is justified by accepting prudent, deliberate technical debt that is well-tracked, and for which there is a plan to resolve.
Complexity signals: what’s actually making things harder?
Some signals don’t sit neatly in one pillar, but they explain a lot.
Things like:
More files changed than usual
More repositories touched
More developers involved in the same piece of work
On their own, these aren’t a problem. But you’ll recognise the pattern – work like this tends to take longer, be harder to review, and more likely to create issues.
The key is context. If you see these alongside delayed PRs, carryover, or rising bugs, that’s not coincidence. It’s a sign the work itself is becoming harder to control.
How to turn risk signals into a risk score
To measure Agile risk properly, we need to combine risk signals and weight them by likely impact on software engineering delivery.
A simple way to think about it is:
Agile risk score = the weighted sum of delivery risk signals.
High-impact signals indicate whether a sprint or epic is on track:
Sprint burndown deviation
Epic delivery drift
Medium-impact signals show where flow is slowing down, and might include:
Delayed pull requests
Tickets without commits
Delayed tickets
Lower-impact signals are often explanatory – they do not always indicate immediate failure, but help explain why delivery is becoming harder. They might include:
More files changed than usual
More repositories changed than usual
More developers involved than usual
Distractions
Unestimated work
The value of a risk score is not that it gives a perfect number. It gives teams a consistent way to see whether risk is rising or falling. It also prevents leaders from overreacting to isolated issues.
See how Plandek automatically surfaces risk through customizable metrics
How to reduce Agile risk
Measuring risk is only useful if it changes what your team does next.
Risk signal | What it usually means | Leadership response | How AI can help |
Delayed pull requests | Review flow is becoming a bottleneck. | Reduce PR size, clarify ownership, protect review capacity and balance reviewer load. | Summarize PR changes, suggest reviewers, flag risky files, generate first-pass review comments and highlight missing tests. AI can speed review, but human review remains essential. |
Tickets without commits | Work has started before it is ready, owned, or actively progressing. | Challenge WIP, clarify requirements, confirm ownership and prioritize finishing over starting. | Analyze ticket wording for ambiguity, suggest missing acceptance criteria, detect stalled work and prompt owners with likely blockers. |
High added work | Sprint scope is changing without visible trade-offs. | Make change explicit: if new work enters, something else should usually leave. | Cluster added work by theme, summarize why it was added, estimate likely impact on sprint capacity and surface repeated sources of interruption. |
Rising carryover | Planning, sizing, flow, or blocker management is breaking down. | Inspect commitment size, reduce batch size, resolve blockers earlier and reset planning assumptions. | Compare carried-over work with original estimates, identify common causes, suggest smaller ticket slices and highlight recurring dependencies. |
Rising quality issues | Output is creating future rework. | Protect engineering quality before pushing speed: improve testing, review depth and defect prevention. | Generate test cases, identify risky code changes, flag likely defects or security issues, and summarize defect patterns. This is useful, but AI-generated code can also increase review and quality risk if not governed properly. |
High distractions | Planned capacity does not reflect actual demand on the team. | Make hidden work visible and rebalance capacity before judging delivery performance. | Classify unplanned work, summarize support/maintenance demand, identify teams or individuals carrying hidden load and show how it affects planned delivery. |
AI is useful here because it can reduce the manual effort involved in spotting, summarizing and acting on risk signals. But it does not remove the need for engineering judgement. In fact, as AI increases code output, leaders need even stronger review, quality and flow signals to understand whether the system is actually improving or just producing more work faster.
Struggling to see delivery risk? Plandek makes it visible.
Many teams lack a clear, trusted view of where delivery risk is actually building.
Plandek gives engineering leaders best-in-class, system-level visibility across the SDLC, built around the Four Pillars of engineering productivity: Focus, Speed, Predictability and Quality.
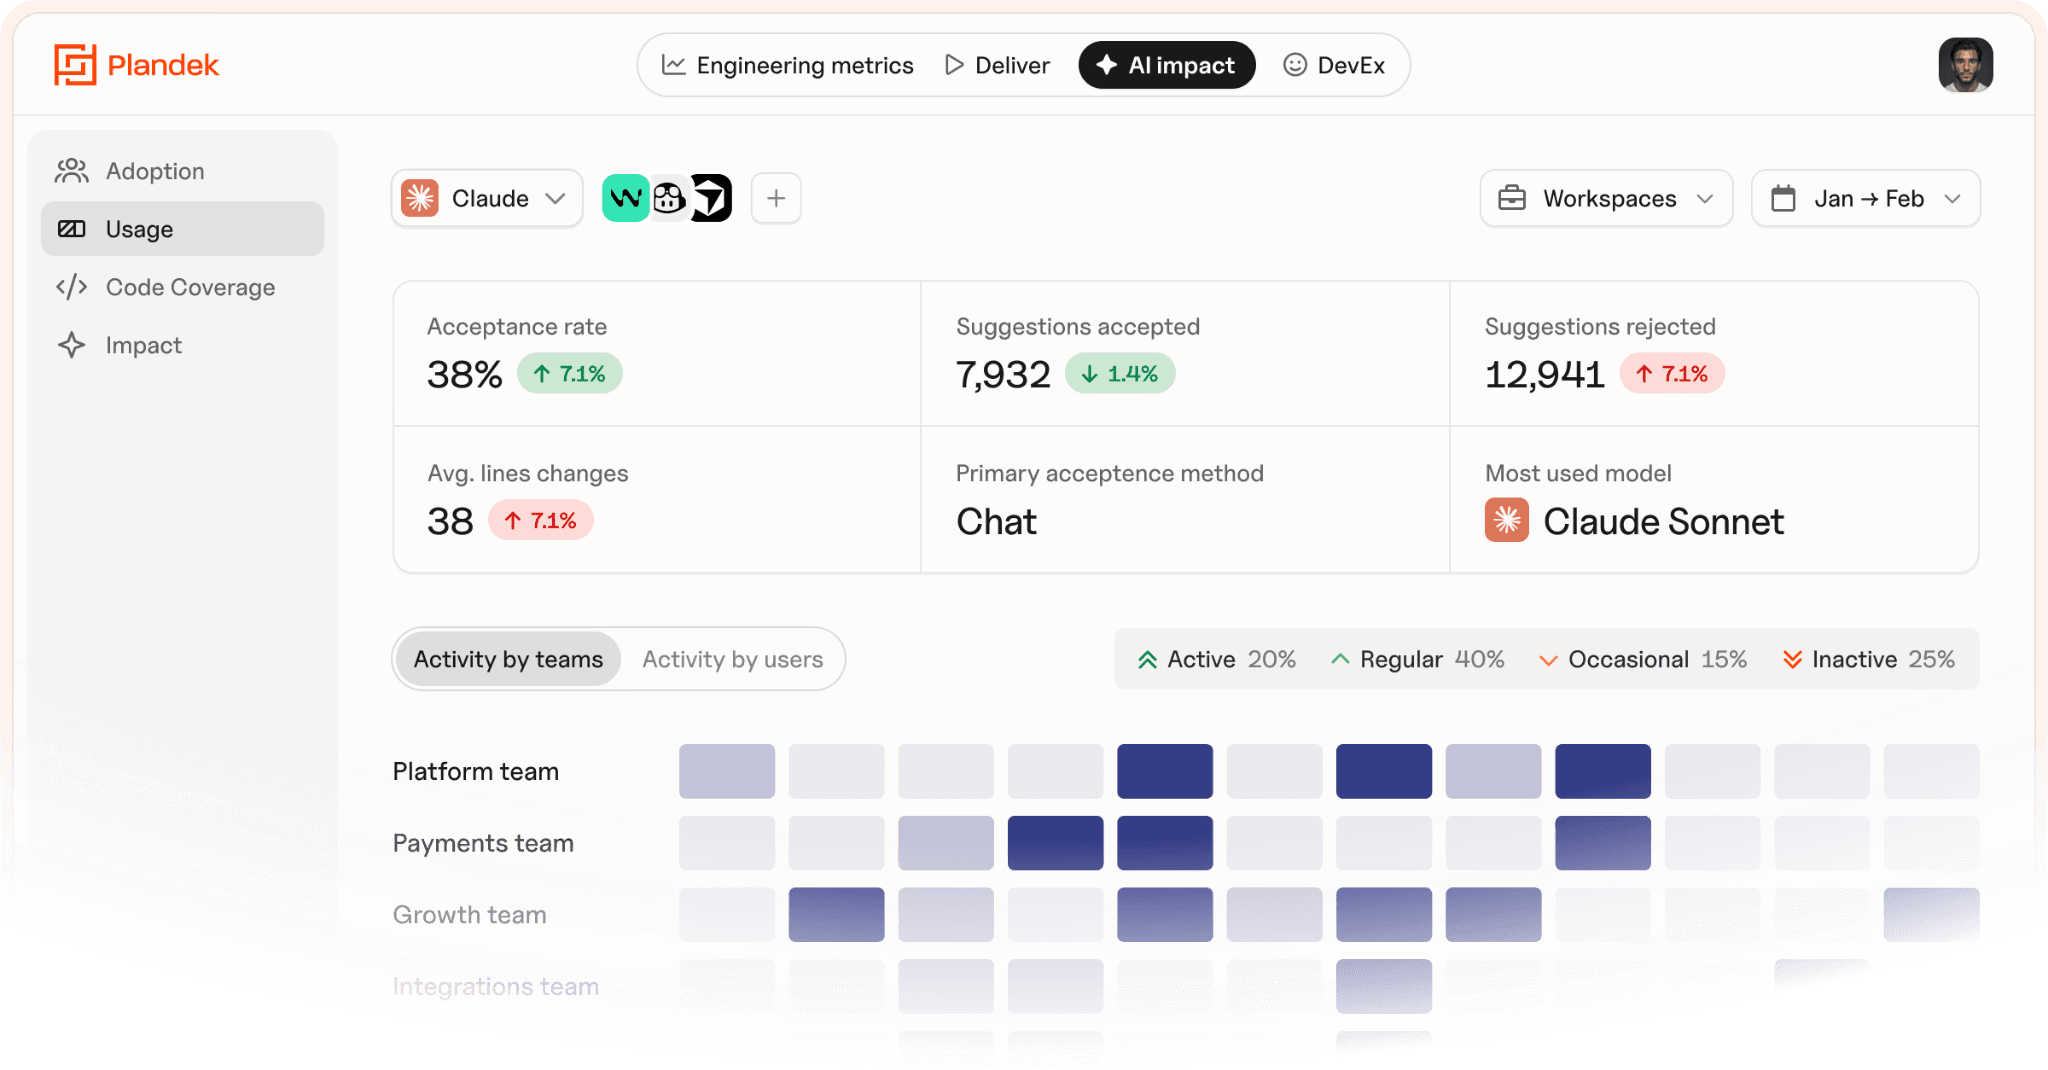
With Plandek, you can drill into the metrics behind each pillar to understand:
where work is drifting from plan
where flow is slowing down or getting stuck
where capacity is being pulled off-track
where output is creating rework
And because Plandek is highly flexible and customizable, you can go deeper: from pillar-level trends into the teams, workflows, tickets, pull requests and risk signals behind them. Unlike rigid engineering analytics tools, Plandek can be shaped around how your organization actually works; your metrics, your delivery model, your teams and your definitions of value.
👉 See how Plandek helps you measure and reduce delivery risk.
Key takeaways
Agile reduces some risk, but it doesn’t remove it. It makes delivery risk visible earlier.
Risk shows up as delivery friction. Delayed PRs, carryover, added work and rising bugs are warning signs.
Productivity metrics and risk signals are different. Metrics show performance; signals show instability.
The Four Pillars help locate risk. Focus, Speed, Predictability and Quality show where pressure is building.
Risk should be measured as a pattern, not a single issue. One delayed PR may not matter; repeated delays usually do.
Reducing risk means fixing the delivery constraint. The right action depends on the signal.
FAQs
What is Agile risk management?
Agile risk management is the practice of identifying, monitoring, and reducing risks continuously throughout the software development lifecycle. Instead of relying only on upfront planning, Agile teams manage risk by observing how work flows and responding to issues as they emerge.
How do Agile teams measure risk?
Agile teams measure risk by tracking delivery signals such as cycle time, delayed pull requests, carryover, added work, defect trends and delivery drift.
What are common Agile risk signals?
Common Agile risk signals include PRs waiting too long for review, tickets without commits, repeated carryover, mid-sprint scope change, rising bugs and epics drifting from plan.
What is the difference between productivity metrics and risk signals?
Productivity metrics show how the delivery system is performing. Risk signals show where that performance is becoming unstable.
How can Agile teams reduce delivery risk?
Agile teams reduce delivery risk by acting on the signal causing it: unblocking reviews, reducing WIP, controlling scope change, improving quality, or making hidden work visible.


See how your engineering efforts translate into measurable business impact
Measure delivery performance, AI impact, and engineering productivity with hundreds of metrics, OOTB dashboards and custom configurations.










NEW
Contact us
UK Office
Unit 313 The Print Rooms, 164-180
Union St, London SE1 0LH
US Office
Floor 4, 1515 Mockingbird Ln,
Charlotte, NC 28209, USA