


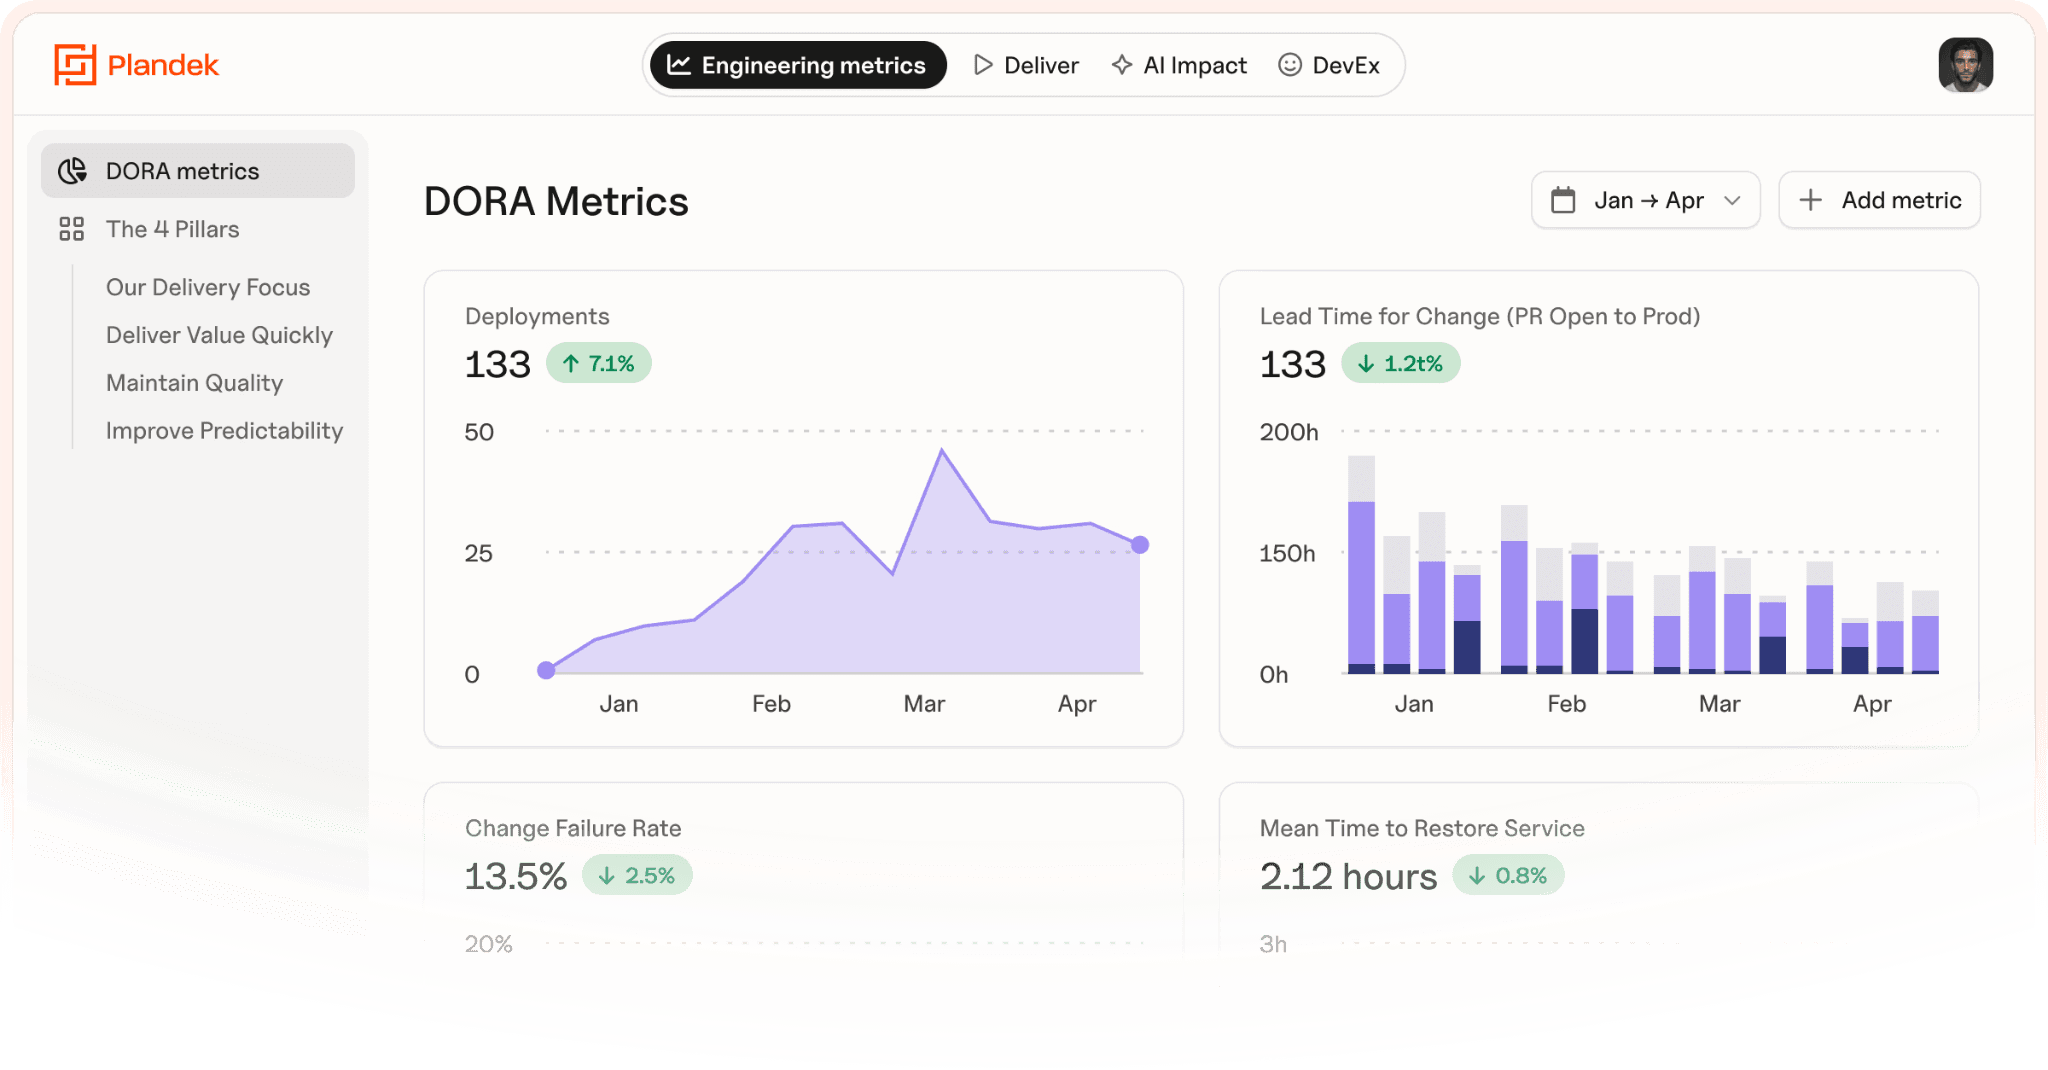
DORA metrics are five DevOps performance metrics that measure software delivery performance: deployment frequency, lead time for changes, failed deployment recovery time, change fail rate and deployment rework rate.
The five DORA metrics help software engineering teams improve DevOps performance, identify and fix bottlenecks and improve reliability of delivery.
In this guide:
What are DORA metrics?
What are the five DORA metrics?
How to benchmark DORA metric performance?
How to interpret DORA metrics?
How to adapt DORA metrics for AI-enabled software engineering?
What are DORA metrics?
DORA metrics are five DevOps performance metrics developed by DevOps Research and Assessment to measure software delivery performance.
The four core DORA metrics are:
Deployment frequency – How often do you deploy?
Lead time for changes – How long does code take to get from writing code to production?
Failed deployment recovery time – How fast do you fix failures?
Change fail rate – How often do deployments fail?
The fifth DORA metric is:
Deployment rework rate – How many deployments are triggered by incidents?
DORA metrics emerged from years of research by the DevOps Research and Assessment team, later synthesised in Accelerate by Nicole Forsgren, Jez Humble, and Gene Kim. That research showed a clear link between software delivery performance and organizational outcomes, giving engineering leaders an evidence-based way to understand how well their delivery systems actually work.
Once called the “four keys”, the model has evolved into five metrics.
DORA metrics help us assess how quickly and reliably we deliver software, and whether that performance is improving over time.
Ongoing research from Google’s DORA team publishes findings here.
The five DORA metrics explained
The five DORA metrics are best understood as a system. Three measure throughput (how fast work moves), and two measure stability (how safely it is delivered). High-performing teams do not trade one for the other.
1. Deployment frequency
Deployment frequency measures how often our teams release code to production. It’s a core DORA metric used to assess how quickly software moves through the delivery pipeline.
In practice, it reflects small batch sizes, strong automation, and confidence in testing and release processes. When deployments are painful, teams deploy less. The opposite is also true.
Benchmarks
Elite: 1+ deployment daily
High-performing: 1+ deployment weekly
Medium: 1+ deployment every 2-4 weeks
Low-performing: <1 deployment per month
Our benchmarks are taken from the Accelerate State of DevOps
2. Lead time for changes
Lead time for changes (also called change lead time) measures how long it takes for committed code to reach production. It is one of the most important DevOps performance metrics for understanding delivery speed.
Lead time is rarely about coding speed. It’s mostly about where work waits in queues, such as pull request reviews or QA handoffs. When lead time is high, the issue is almost always flow, not effort.
Benchmarks
Elite: <1 day
High-performing: <1 week
Medium: <1 month
Low-performing: 1 month or more
3. Failed deployment recovery time
Failed deployment recovery time measures how quickly our teams restore service after a deployment failure caused by a code change.
This is more useful than generic Mean Time to Recover (MTTR) because it isolates failures we introduced ourselves. It gives a clearer signal of how resilient our delivery system is to change.
Elite: <1 hour
High-performing: <1 day
Medium: <1 week
Low-performing: >1 week
4. Change fail rate
Change fail rate measures the percentage of deployments that result in failures requiring immediate remediation, such as rollbacks or hotfixes.
This metric only makes sense in context. A low failure rate with very infrequent deployments can signal risk avoidance, not quality. Healthy systems balance both throughput and stability.
Benchmarks
Elite: 0-15% failure rate
High-performing: 15-22% failure rate
Medium: 22-30% failure rate
Low-performing: 30%+ failure rate
5. Deployment rework rate
Deployment rework rate measures the proportion of deployments that are unplanned and triggered by production incidents.
This is one of the most revealing software delivery performance signals. High rework means teams are spending capacity fixing issues instead of delivering new value—an early warning sign of systemic quality or workflow problems.
Rework is a new metric without official benchmarks.
Think of this metric as a signal for system health and wasted capacity.
How to measure DORA metrics
At a minimum, you need four data sources:
Version control (e.g. GitHub, GitLab, BitBucket) → commits, pull requests
CI/CD pipelines (e.g. CircleCI, Jenkins) → builds, deployments
Incident management (e.g. PagerDuty, New Relic) → failures, recovery
Workflow management (e.g. Jira, Azure DevOps) → work items, scope, issues
What to measure, by DORA metric
Deployment frequency: count successful production deployments from your CI/CD pipeline
Lead time for changes: measure time from commit → production (Git + deployment data)
Change fail rate: % of deployments linked to incidents, rollbacks, or hotfixes
Failed deployment recovery time: Time from incident start → service restored (incident tools)
Deployment rework rate: % of deployments triggered by incidents rather than planned work
Get started measuring DORA metrics
Option 1: Use your existing toolchain (fastest start)
Pull data from Git, CI/CD, and incident tools
Use scripts or dashboards to correlate events
Works well early, but becomes fragile at scale
Option 2: Build a custom pipeline (maximum control)
Aggregate data across systems into a unified model
Map PRs → deployments → incidents
High effort, ongoing maintenance cost
Option 3: Use a delivery intelligence platform (most scalable)
Plandek offers best-in-class customizability to understand your SDLC data automatically
Provide DORA metrics with context (flow, bottlenecks, rework)
Enable drill-down from metric → root cause
How to interpret DORA metrics
Single DORA metrics are useful. Patterns are better. They show how the delivery system is behaving.
Pattern | What it usually means | Where to look first |
High deployment frequency + long lead time | Work is still batching somewhere in the system | PR review queues, delayed releases after merge, handoffs |
Low deployment frequency + long lead time + high failure rate | Delivery is fragile and risk-heavy | Large changes, weak test coverage, manual releases, fear of deployment |
High deployment frequency + high rework rate | The team is moving fast, but creating instability | Quality controls, unclear requirements, rushed releases |
Low failure rate + high rework rate | Stability may be overstated | Failure classification, slow-burn defects, hidden remediation work |
Improving deployment frequency + worsening lead time | Local optimisation, not system improvement | Review/testing capacity, release queues, work-in-progress |
Stable DORA metrics + declining outcomes | The metrics are losing connection to value | Gaming, misclassification, weak product alignment |
AI-specific patterns to watch
AI makes this interpretation more important because activity can rise without delivery improving.
AI-era pattern | What it usually means | Where to look first |
Rising activity + flat deployment frequency | More work is entering the system, but not reaching production | Review bottlenecks, integration complexity, coordination overhead |
Faster lead time + rising failure rate | Batch discipline or review quality may be breaking down | Larger AI-generated changes, shallow reviews, overconfidence in automation |
High throughput + declining predictability | The delivery system is under strain | Planning quality, dependency management, scope volatility |
DORA metrics and AI-enabled software delivery
At their best, DORA metrics give us a clean baseline for software delivery performance:
Are we delivering quickly, safely, and recovering well when things break?
They help our teams:
Establish a shared truth about delivery performance
Spot bottlenecks early: lead time, failure rate, recovery time, rework
Create a common language across engineering, product, and leadership
Connect engineering delivery to business outcomes through faster, safer releases
That is why DORA research still matters: high-performing teams consistently perform better on both delivery and organizational outcomes:
But DORA has a hard limit.
It tells us what is happening. It often does not tell us why.
If lead time rises, the cause could be anything from slow code reviews to quality debt.
AI can increase output, but that does not mean the delivery system improves. The constraint often moves downstream into reviews, testing, architecture, release coordination, or quality control.
Read our Complete Guide to Engineering Bottlenecks here
So DORA becomes both:
more important — it keeps us honest about whether faster coding actually improves delivery
less sufficient — it cannot explain whether AI is creating sustainable productivity or just more work-in-progress
The real question is not “do our metrics look better?”
It is:
Are we moving faster, or creating more rework?
Are we releasing more often, or slicing up the wrong work?
Are failures falling because quality improved, or because deployments slowed?
Is AI improving delivery, or just increasing upstream activity?
This is where Plandek’s Four Pillars of Engineering Productivity help. They can be used alongside DORA to make DORA operational.
The Four Pillars translate delivery signals into four leadership questions:
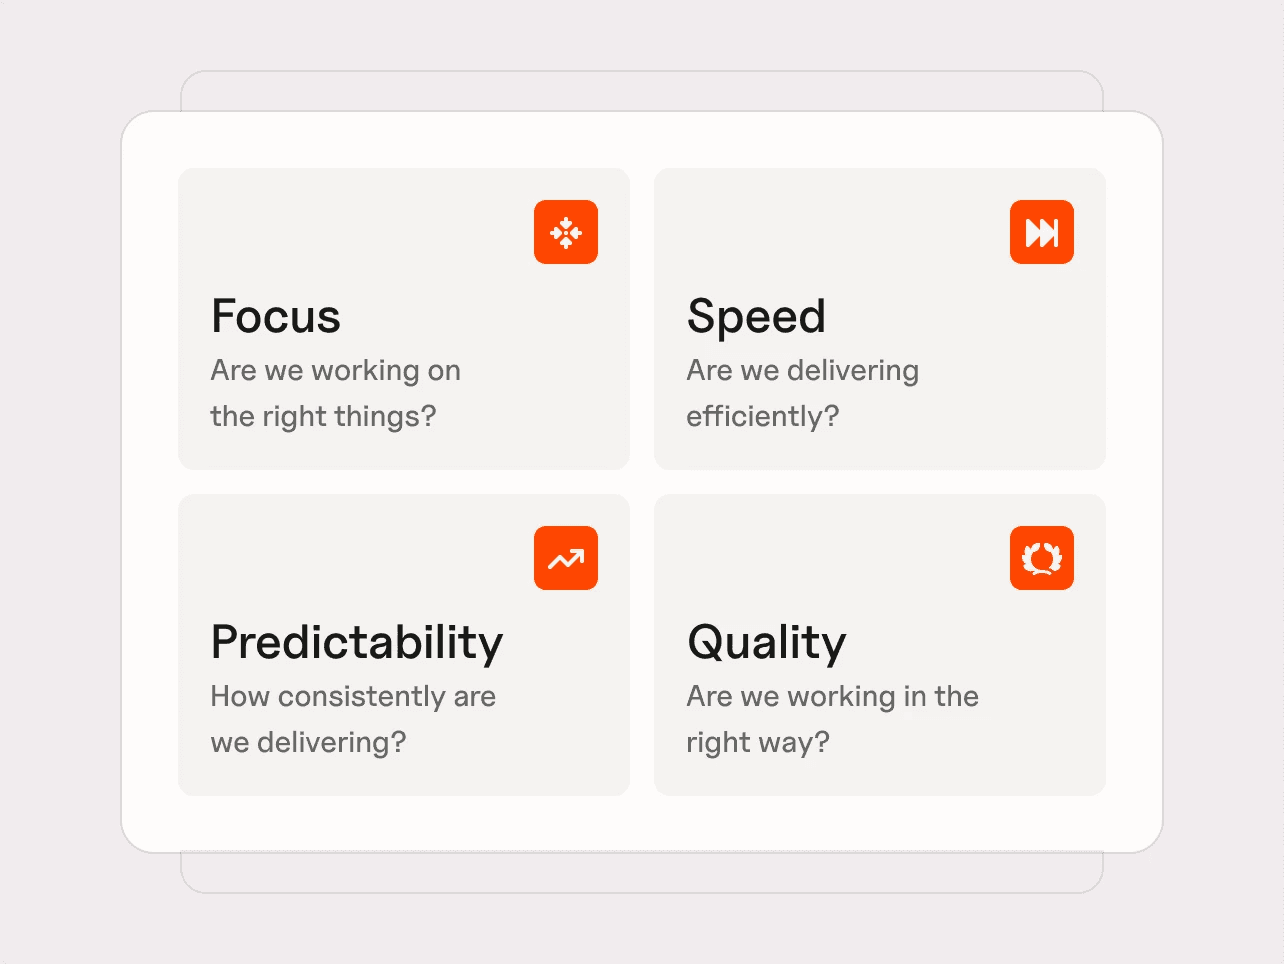
Focus – are we working on the right things?
How much engineering capacity is directed toward value delivery, rather than being consumed by support, rework, or maintenance?
Value Delivery %
Support and Maintenance %
Speed – are we delivering efficiently?
How quickly does work move from idea to production, and how efficiently teams convert effort into delivered output?
Lead Time to Value
Cycle Time
Throughput Quotient
Time to Merge PRs
PR Efficiency Quotient
Merge Frequency per author (per week)
Predictability – how consistently are we delivering?
How reliably can teams plan and execute work, without excessive volatility or disruption?
Sprint Capacity Accuracy
Sprint Target Completion
Mid-Sprint Scope Change
Velocity Volatility
Quality – are we delivering sustainably?
Is increased throughput creating lasting value, or generating defects and rework that consume future capacity?
Bug Resolution Time
Stories Delivered : Bugs Raised ratio
Bugs Resolved : Bugs Raised ratio
These metrics give a system-level view of engineering productivity which can be operationalized to reveal where and how work turns into value – and where bottlenecks are occurring.
DORA metrics vs Four Pillars: from signals to decisions
DORA Metric | Where DORA falls short | Four Pillars metrics | How to use these together |
Deployment frequency | Shows how often we deploy, but not whether this reflects meaningful progress or just higher activity | Merge Frequency per Author, PR Efficiency Quotient, Throughput Quotient | Use alongside PR and merge metrics to confirm deployments come from small, high-quality changes, not just more output |
Lead time for changes | Measures commit-to-production time, but misses delays before coding starts | Lead Time to Value, Cycle Time, Time to Merge PRs | Use Lead Time to Value to identify where time is really lost across the system—planning, reviews, or release |
Failed deployment recovery time | Focuses on recovery from incidents, but not whether defects are accumulating | Bug Resolution Time, Bugs Resolved : Bugs Raised | Combine with defect metrics to understand whether teams are recovering quickly and keeping quality under control |
Change fail rate | Shows failure at deployment, but not broader quality trends or hidden defects | Stories Delivered : Bugs Raised, Bugs Resolved : Bugs Raised | Use to assess whether increased output is creating more defects or degrading quality over time |
Deployment rework rate | Highlights reactive deployments, but not the full impact on team capacity | Support & Maintenance %, Value Delivery % | Use to see whether reactive work is consuming roadmap capacity and reducing focus on new value |
Common mistakes with DORA metrics
DORA metrics are useful, but they do not give the full picture. They show how software delivery is performing, but not always why — or whether teams are delivering the right work.
The real mistake is treating DORA as a complete operating model, rather than one important lens within a broader view of engineering productivity.
1. Treating DORA as the whole story
DORA tells us about delivery speed and stability. It does not fully explain focus, planning quality, predictability, collaboration, developer experience, or business value.
Better delivery metrics do not automatically mean better outcomes.
2. Ignoring focus
A team can improve deployment frequency and lead time while still spending too much capacity on low-value work, interruptions, or rework.
DORA can show that work is moving. It does not prove the right work is moving.
3. Missing predictability
DORA does not directly tell us whether teams are delivering consistently against expectations.
A team can deploy frequently and still be unpredictable if scope shifts, dependencies block delivery, or plans are unreliable.
4. Optimising speed without quality
Pushing deployment frequency up while change fail rate, recovery time, or deployment rework rate worsens is not improvement. It is faster instability.
DORA should always be read as a balance between speed and quality.
5. Mistaking activity for impact
More deployments, commits, or pull requests do not automatically mean better software delivery performance.
This matters even more in AI-enabled engineering, where activity can rise quickly without improving flow, predictability, quality, or value delivery.
6. Using benchmarks without context
DORA benchmarks are useful context, but poor goals. If we tell teams they “must deploy daily”, we invite gaming.
Cross-team comparisons are risky too. A mobile app, payments platform, data product, and legacy system may have very different constraints.
7. Measuring without acting
Dashboards do not improve delivery. Decisions do.
DORA metrics should trigger action: reduce batch size, unblock reviews, improve test reliability, reduce WIP, strengthen incident response, or cut avoidable rework.
How Plandek helps you apply DORA metrics in practice
DORA metrics are powerful—but only if we can interpret them in context and turn them into action.
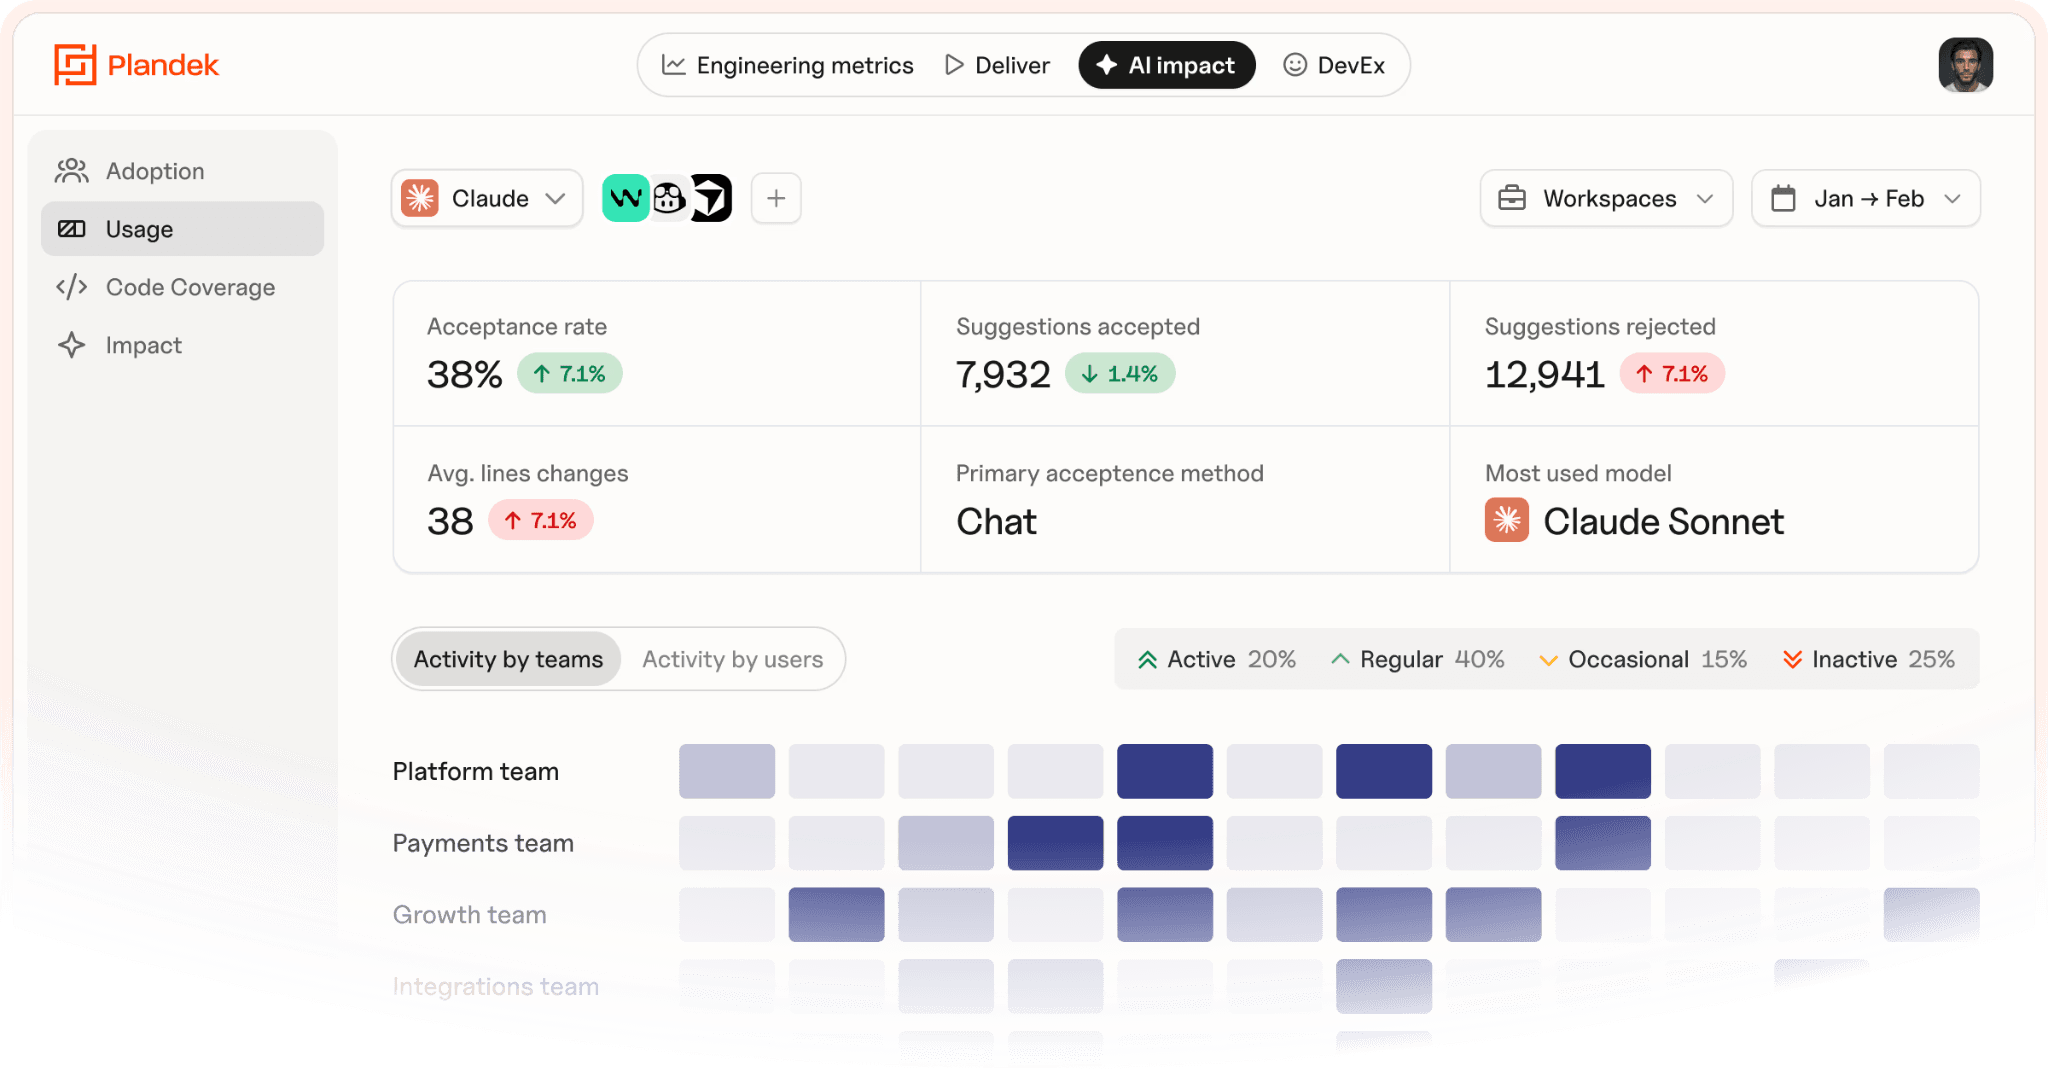
Plandek helps you go beyond tracking DevOps performance metrics to understanding what is actually driving your software delivery performance.
It gives you a system-level view of your SDLC, so you can see:
Where lead time is really being spent (reviews, queues, handoffs)
Why deployment frequency is changing (flow vs batching)
Whether rising throughput is creating instability or rework
How incidents, failures, and recovery are affecting delivery
Instead of looking at DORA metrics in isolation, Plandek connects them across the system—so you can identify the constraint behind the numbers.
Using the Four Pillars of Engineering Productivity, you can interpret DORA through a clearer lens:
Focus – is capacity going to roadmap work or rework?
Speed – where is work waiting?
Predictability – are teams delivering consistently?
Quality – is increased output creating downstream issues?
In AI-enabled engineering, this becomes critical.
Plandek enables you to understand:
Whether increased activity is improving delivery—or just exposing bottlenecks
Where constraints are shifting as throughput increases
How flow, predictability, and quality are evolving as AI adoption scales
👉 See how Plandek helps you turn DORA metrics into actionable delivery insights
Key takeaways
DORA metrics measure software delivery performance: how quickly, safely, and reliably software moves through the delivery system.
There are now five DORA metrics: deployment frequency, lead time for changes, failed deployment recovery time, change fail rate, and deployment rework rate.
DORA is strongest as a baseline: it shows what is happening across delivery speed and stability.
DORA does not explain the full system: it does not fully cover focus, predictability, business value, or developer experience.
AI makes DORA more important, but less sufficient: more code and PRs do not automatically mean better delivery.
The Four Pillars make DORA operational: focus, speed, predictability, and quality help leaders decide where to intervene.
DORA metrics FAQ
What does DORA stand for?
DORA stands for DevOps Research and Assessment. It refers to the research programme behind the software delivery performance metrics used by engineering and DevOps teams.
What are the DORA metrics?
The five DORA metrics are deployment frequency, lead time for changes, failed deployment recovery time, change fail rate, and deployment rework rate. Together, they measure delivery throughput and stability.
Are there four or five DORA metrics?
There were originally four DORA metrics, often called the “four keys”. The modern model uses five metrics, adding deployment rework rate for a fuller view of delivery instability.
Are DORA metrics still relevant with AI?
Yes. DORA metrics are even more useful in AI-enabled engineering because they show whether increased activity is improving real delivery performance, or just creating more downstream bottlenecks.
Are DORA metrics enough to measure engineering productivity?
No. DORA is a strong delivery baseline, but it does not fully explain focus, predictability, collaboration, developer experience, or business value.
How often should teams review DORA metrics?
Teams should review DORA metrics regularly, usually weekly or monthly, focusing on trends rather than single data points. The goal is to guide improvement, not run a reporting exercise.
Written by
Charlie Ponsonby
Co-founder & CEO
Charlie Ponsonby is CEO and Co-founder of Plandek, the leading Developer Productivity Insight (DPI) platform that helps software engineering teams drive productivity and transition to AI-led engineering. He writes widely on the opportunities and challenges inherent in the transition to the agentic SDLC. Prior to founding Plandek, Charlie founded Simplydigital, which grew to become the UK's largest broadband and digital services comparison business before being acquired by Europe's largest consumer electronics retailer. He started his career at Accenture and has held senior leadership roles in retail and telco. Charlie holds a degree from the University of Cambridge.


See how your engineering efforts translate into measurable business impact
Measure delivery performance, AI impact, and engineering productivity with hundreds of metrics, OOTB dashboards and custom configurations.


Contact us
UK Office
Unit 313 The Print Rooms, 164-180
Union St, London SE1 0LH
US Office
Floor 4, 1515 Mockingbird Ln,
Charlotte, NC 28209, USA