


As an engineering leader, you need to be able to answer three questions:
How productive is engineering? How do we compare? And where should we focus next?
You may already have hundreds of metrics and dozens of dashboards. But when the CEO, board, or investment team asks whether engineering is performing well, a dashboard full of cycle times, deployment frequencies, and pull request data is not an answer.
You need a clear view of performance and credible external context. Then, you need to turn both into a decision about what happens next.
That is why we built ProductivityRadar™.
One clear view of engineering productivity
ProductivityRadar™ gives you one benchmarked productivity score, grounded in data from more than 2,000 engineering teams.
In 30 seconds, you can see where engineering stands. You can understand how performance compares to other organizations, whether it is improving or declining, and how confidently you should be talking about it with the rest of the business.
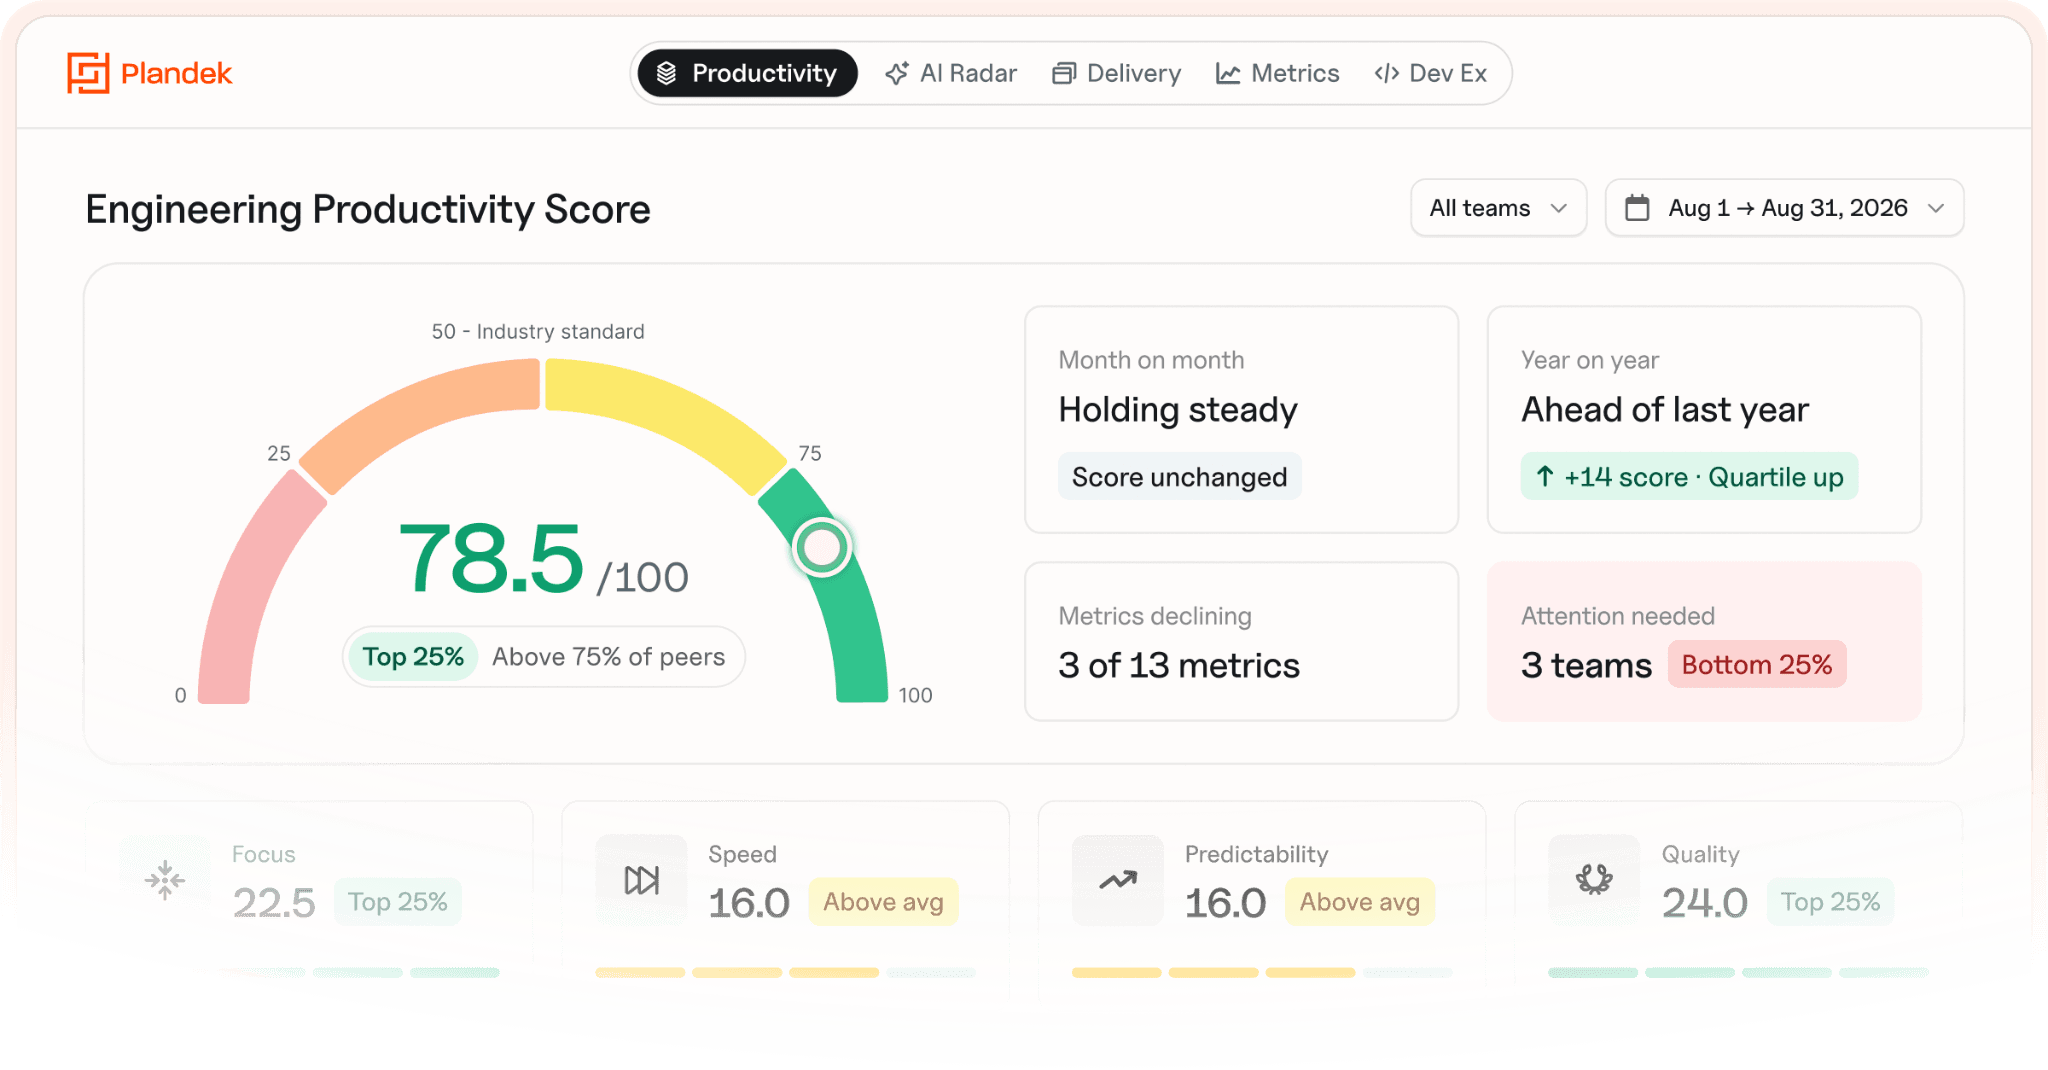
The score is underpinned by Plandek’s four pillars of engineering productivity:
Focus
Speed
Predictability
Quality
Productivity is not simply about moving faster. A team that ships quickly but unpredictably, sacrifices quality, or spends too little time on strategic work is not necessarily productive.
“Engineering leaders are increasingly expected to give boards a clear, evidence-based view of productivity. But disconnected metrics rarely provide that clarity. ProductivityRadar™ gives leaders a simple, benchmarked way to explain where engineering stands, what is driving performance, and where the business should focus effort.”
Charlie Ponsonby, CEO and co-founder of Plandek
Turn measurement into a leadership agenda
A productivity score is only useful if it helps you decide where to act.
Within ten minutes, ProductivityRadar™ shows you which areas need attention, which metrics are moving in the wrong direction, and where the first leadership conversation should happen.
ProductivityRadar™ gives you a detailed breakdown of the metrics behind your score, ranked and grouped across Focus, Speed, Predictability, and Quality.
This view shows you at a glance:
Your current organizational value for each metric
How performance has changed quarter over quarter and year over year
Which quartile you sit in against the benchmark
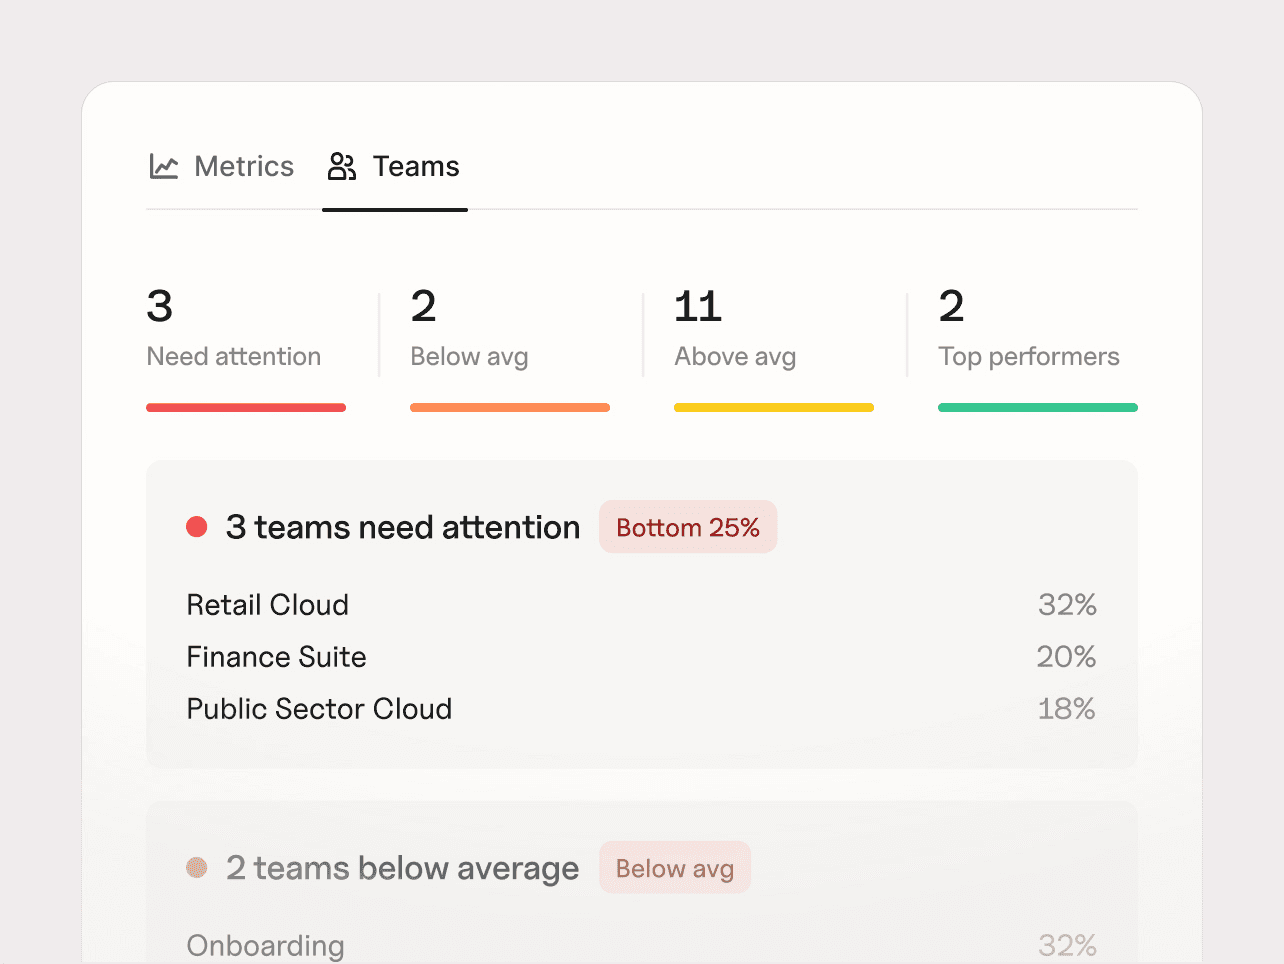
Whether poor performance is widespread or concentrated in particular teams
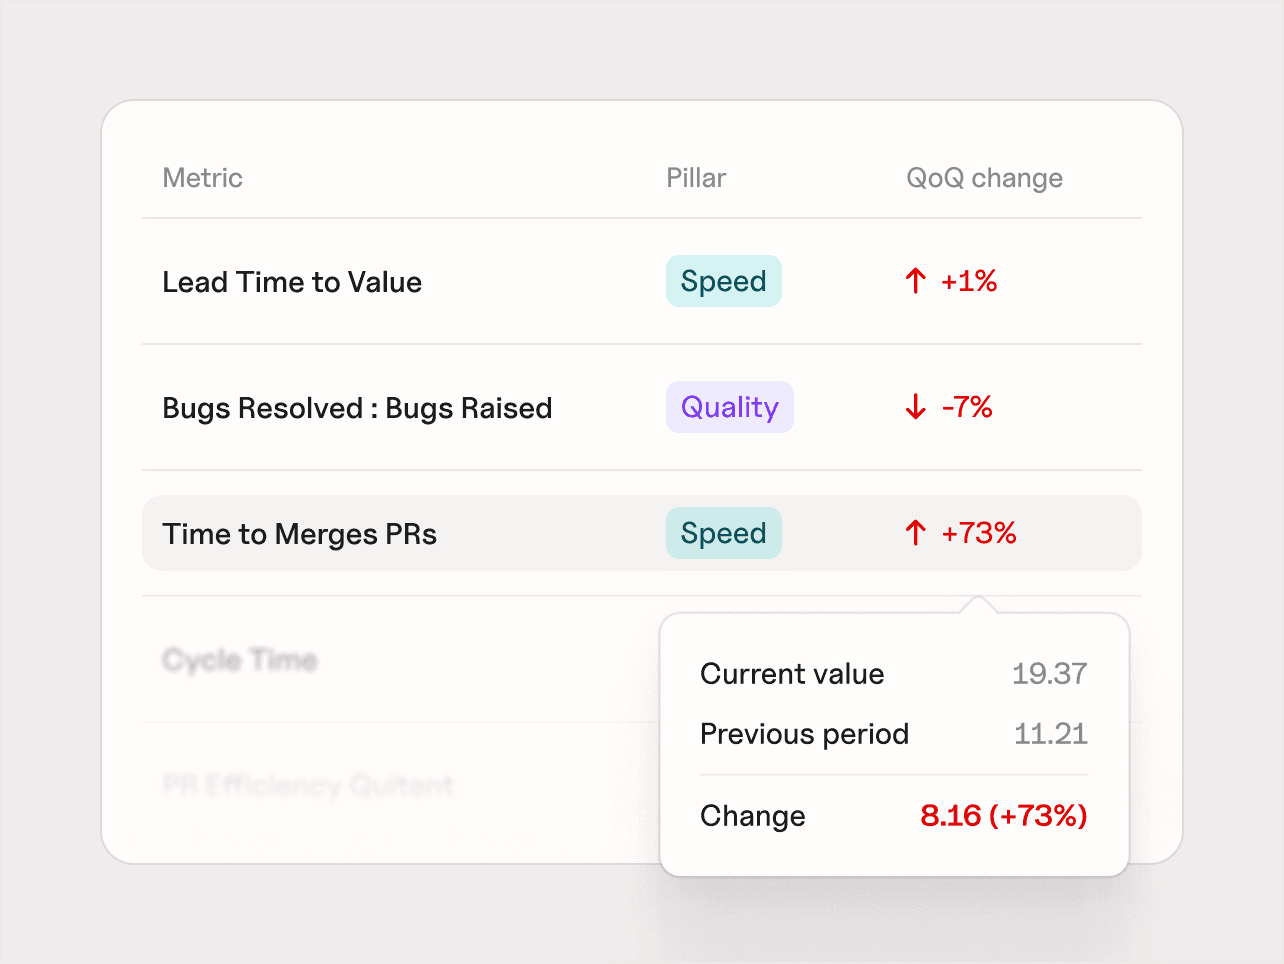
Filter by pillar, performance direction, or quartile to cut through the noise and find the evidence that matters.
Plandek Premium Plan customers can drill down to understand whether a problem affects the whole engineering organization or is concentrated in a particular team, workspace, or category.
A systemic problem may require a change in operating model, tooling, or leadership priorities. A localized problem may need targeted support. ProductivityRadar™ helps you tell the difference before you spend time and money solving the wrong issue.
See how teams are really adopting AI
AI adoption is not one-dimensional. ProductivityRadar™ groups teams using two signals: how often they use AI and how much AI contributes to merged pull requests.
You can quickly distinguish habitual users, high-impact power users, strategic users, and teams that remain unengaged – then compare those adoption patterns with productivity performance.
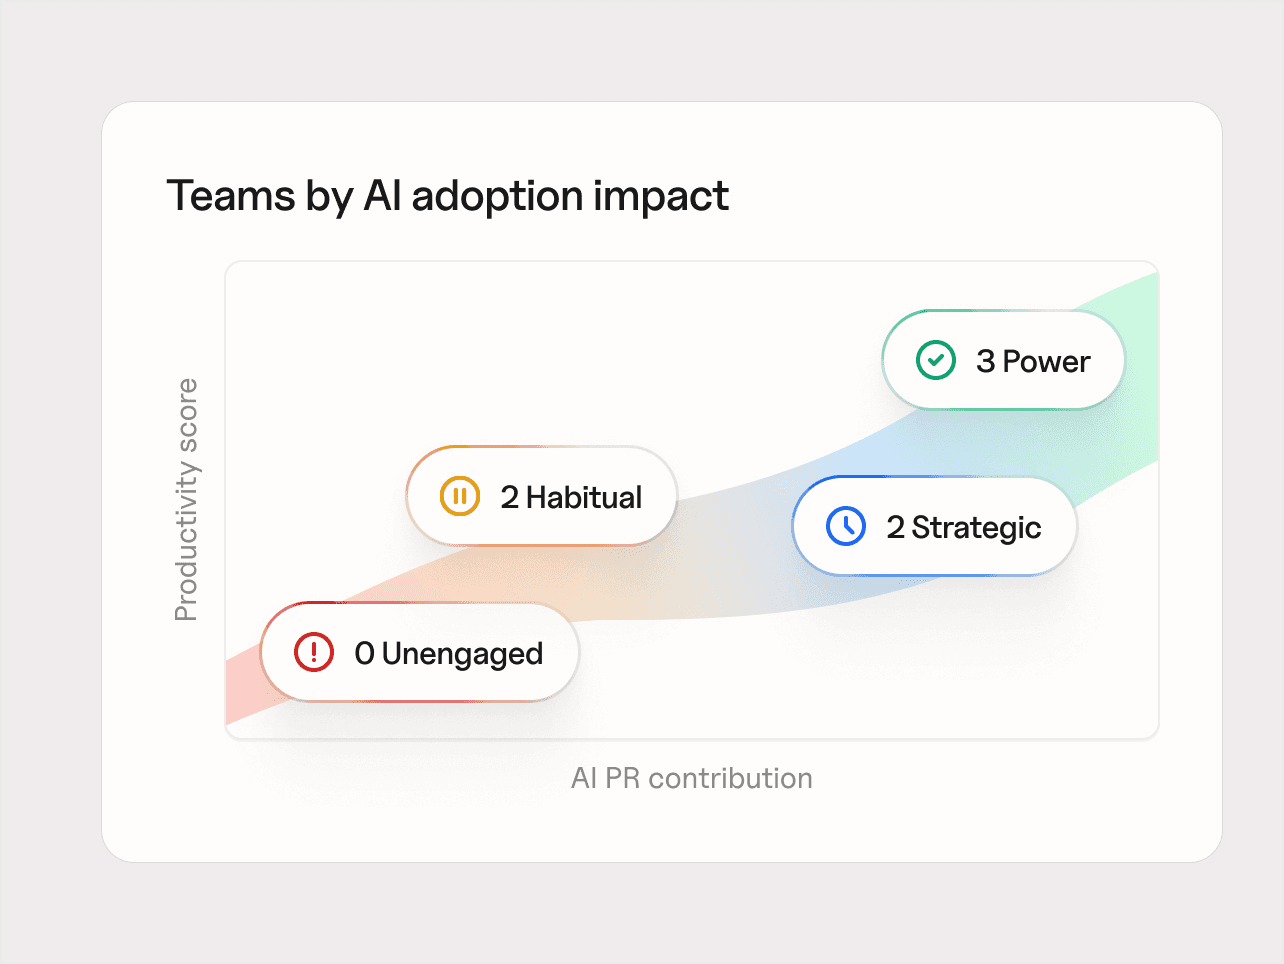
That gives you a more useful question than “Who has an AI license?” You can see where AI is becoming part of delivery, where teams may need support, and whether different patterns of adoption are translating into better engineering outcomes.
Lead the conversation with evidence
You should not have to assemble a new productivity story every time a leadership meeting approaches.
ProductivityRadar™ gives you a clear, repeatable view of engineering performance, benchmarked against real teams and structured around the decisions you need to make.
Talk to our Agile & AI Transition experts today to see how Plandek could work with your data.
Written by
Betsy Earnshaw
Product Manager, ProductivityRadar™
Betsy leads the development of ProductivityRadar™, working closely with customers to turn complex engineering data into clear, actionable insight. She’ll demonstrate the product and show how leaders can turn productivity insight into better decisions.


See how your engineering efforts translate into measurable business impact
Measure delivery performance, AI impact, and engineering productivity with hundreds of metrics, OOTB dashboards and custom configurations.












NEW
Contact us
UK Office
Unit 313 The Print Rooms, 164-180
Union St, London SE1 0LH
US Office
Floor 4, 1515 Mockingbird Ln,
Charlotte, NC 28209, USA