


What is Cycle Time, and How to Reduce It
Most engineering teams are measuring cycle time, but taking action on it is harder to get right.
The metric is one of the most actionable signals available to engineering leaders. But it's also one of the most commonly misapplied. Teams treat it as a proxy for software engineering productivity overall, when it's really a signal about flow through the software development lifecycle.
Optimizing for a faster number and actually improving your delivery system are not the same thing, and confusing them tends to make both worse.
In this article, we’ll explain what cycle time actually tells you, what it doesn't, and how to use it as part of a system.
What is Cycle Time in software engineering?
Cycle Time captures the time it takes for a team to deliver a new piece of valuable software to a user. It is calculated from the point at which development starts, to the point at which it is deployed to production.
It’s not measuring from when it was requested or planned; it starts from when active development started, through to deployment. That distinction is important. Cycle time and lead time are frequently conflated. They measure different things:
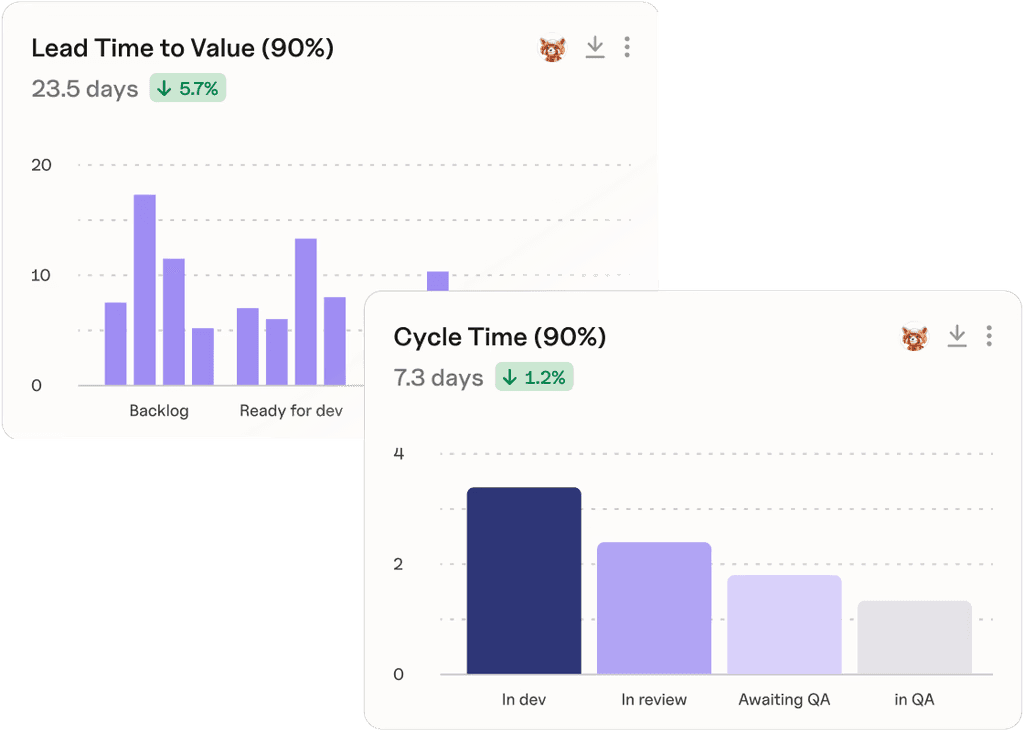
Cycle time – starts when active development begins; ends at production deployment. Tells you about your delivery flow once work is in motion.
Lead time – starts when work is requested or planned; ends at production deployment. Tells you about your system's responsiveness from the customer's perspective.
Both matter, but they answer different questions, and conflating them leads to the wrong diagnosis.
Cycle time can be broken down into sub-components, because the aggregate figure often obscures where the real problems are:
Time to Review – from when the PR is opened to the first comment or review
Time to Approve – from first review to approval
Time to Merge/Close – from approval to merge or close
Time to Deploy – from merge to deployment in production
Each of these can be a distinct bottleneck. A team with fast reviews but slow deployments has a different problem than one where code sits unreviewed for days. Treating cycle time as a single number prevents you from seeing that.
Learn more about how to spot and fix software engineering bottlenecks here
What does good Cycle Time look like?
Plandek’s 2026 Engineering Productivity Benchmarks, with data from over 200 teams, shows that top-performing teams maintain cycle times of under 6.6 days, while the bottom quartile deliver in over 14.3 days.
In fact, high-performing teams with shorter Cycle Times are 2x more likely to meet or exceed their business goals and deliver value faster.
Your cycle time is worth knowing, but apply it with caution. Imagine these two teams, same cycle time number – very different realities:
A team shipping small, vertically sliced stories with fast feedback loops
A team pushing large, complex features with long integration cycles
Comparing teams without controlling for this produces misleading conclusions.
What causes long Cycle Times?
Long cycle times rarely have a single cause. They're the product of technical, organizational, and process-level problems layered on top of each other.
Technical causes
The most visible causes – but not always the most important ones.
Large pull requests are one of the most reliable predictors of slow cycle time – harder to review, more likely to queue, more likely to generate back-and-forth
Brittle CI pipelines – flaky tests and slow builds add delay at exactly the point where you need speed and confidence
Technical debt compounds over time, consuming capacity that should be moving work forward
Expert insight: PR size is one of the highest-leverage variables you can control. Smaller PRs move faster, attract better feedback, and introduce fewer defects – and it's one of the easiest interventions to implement tomorrow.
Organizational causes
This is where most cycle time discussions go shallow – and where the real leverage often sits.
Cross-team dependencies inflate cycle time in ways that are largely invisible in individual team metrics – make them visible and manage them actively
Overload and context switching are equally damaging. Research by Dr. Gloria Mark at UC Irvine found it takes 23 minutes to fully regain focus after a single interruption – engineers pulled in multiple directions accumulate process debt because there's no slack to improve anything
Expert insight: Running teams at maximum utilization is a false economy. A system with no buffer can't absorb the unexpected or improve itself.
Process causes
Process creep is slow, invisible, and cumulative.
Steps get added to workflows because they feel prudent, but they’re rarely removed; while each additional handoff or approval gate adds wait time.
Expert insight: Treat process removal as requiring the same deliberate effort as process addition. If a step can't be justified by quality, compliance, or risk reduction, the default should be removal.
The AI dimension
AI is increasing the rate work enters your delivery system – not the rate it exits.
AI doesn't create value when code is written – it creates value when that code reaches production, at quality, on time
But Plandek’s research shows that AI adoption produces more PRs, while significantly increasing PR review time
The DORA 2024 report found the same pattern: individual output increased, but system-level delivery metrics stayed flat
Expert insight: AI acts as a multiplier – amplifying efficiency in well-run systems and exposing dysfunction in poorly-run ones. Fix the system first; then AI compounds the gains.
How to use Cycle Time with other metrics
Cycle time is one signal within a wider delivery system.
The four core DORA metrics – deployment frequency, lead time for changes, change failure rate, and mean time to recovery – provide useful context around cycle time, particularly lead time for changes, which measures the pipeline efficiency dimension that cycle time doesn't fully capture.
But even the full DORA set has limits. At Plandek, we measure engineering productivity across four dimensions – Focus, Speed, Predictability, and Quality – what we call the Four Pillars of Software Engineering Productivity. Cycle time sits within the Speed pillar, and Speed is only one quarter of the picture:
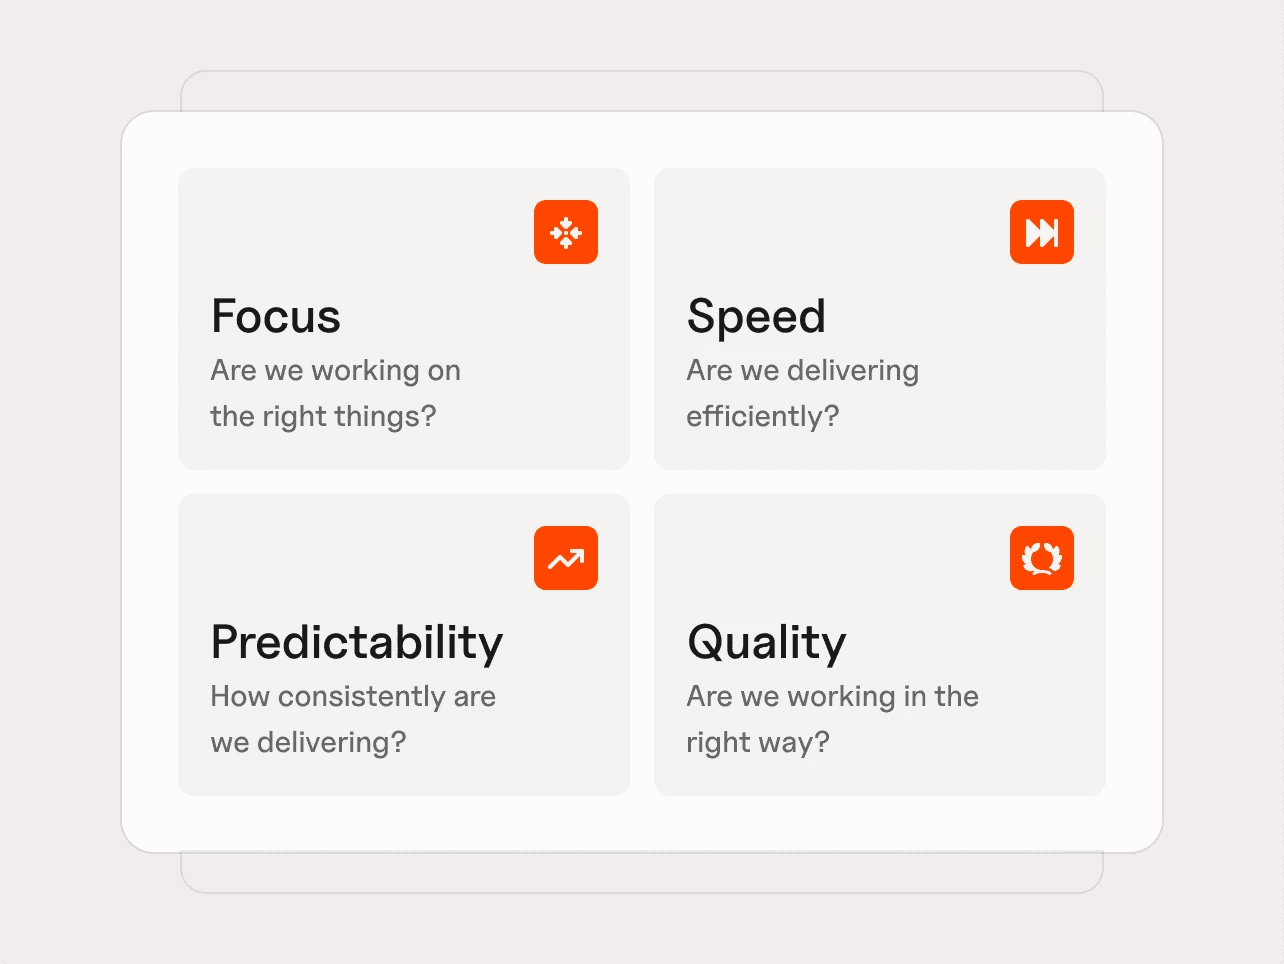
The pillars move together. Push hard on Speed without watching Quality and Predictability and the system degrades – often invisibly, until the damage is already done.
How to reduce Cycle Time
The starting point is diagnosis, not intervention. Too many teams jump to solutions before they understand where time is actually going.
Value stream mapping – tracing the flow of work from start to production – is the most useful exercise here. Supplement it with sub-component analysis: where is pickup time longest? Where does review time spike? Where does deployment add delay? Developer surveys add the qualitative layer that engineering metrics miss – but focus them on workflow impediments specifically, not general process feedback. Engineers usually know where the friction is; they're rarely asked the right question.
Once you know where the problems are, the interventions become more obvious.
1. Reduce batch size
Smaller, vertically sliced stories reduce queue time, simplify reviews, and make integration less risky.
Trunk-based development and feature flags support this by decoupling deployment from release. Worth noting: research on 19,000+ contributors found that Time to Open – the gap between earliest commit and when the PR is opened – has the highest correlation to short cycle time of any measured driver. Batch size affects cycle time before the PR is even created.
2. Fix the review bottleneck
The pull review process is often the most consequential and most overlooked sources of delay.
Code cycle time typically accounts for around 30% of overall cycle time. If review time is your longest sub-component, the solution isn't to tell people to review faster – it's to make reviewing easier:
Smaller PRs with clear descriptions reduce cognitive load
Automated quality checks reduce what human reviewers need to catch
Explicit SLAs for review response times turn a cultural problem into a measurable one
Pair programming on complex features can eliminate review bottlenecks entirely for high-stakes work
AI-assisted reviewing processes
Actively managing code cycle time typically reduces overall lead time by 5–10%.
3. Address organizational drag
WIP limits are one of the most evidence-backed tools for improving flow.
Start by making work in progress visible. Dependency mapping across teams surfaces blockers that individual team metrics don't show. Build slack into schedules deliberately: a team at 100% utilization has no capacity to resolve the problems slowing everyone else down. This matters more as AI accelerates output – review processes that haven't scaled with AI-driven PR volume become a structural bottleneck that tooling alone won't fix.
4. Invest in the pipeline
Slow, unreliable CI/CD is a tax on every deployment.
Investment in build speed, test reliability, and deployment automation pays compound returns. Self-service deployment capabilities that reduce reliance on platform teams remove a common source of late-stage delay.
5. Treat technical debt as a cycle time strategy
Technical debt rarely gets prioritized because its cost is distributed and invisible.
However, research suggests it can consume as much as 23% of development time. Making that cost visible, in terms of its measurable contribution to cycle time and unplanned work, changes the conversation from "should we address technical debt?" to "how much cycle time are we willing to sacrifice by not addressing it?"
6. Use software to track cycle time improve developer productivity
Cycle time is a valuable signal, but it is most useful as one input in a broader picture of engineering performance.
Plandek tracks cycle time and its sub-components alongside every metric that gives it meaning – DORA metrics, Four Pillars metrics, flow metrics, and 50+ additional delivery metrics – across the full software delivery lifecycle.
With Plandek, you get:
Cycle time sub-component tracking – Time to Review, Time to Approve, Time to Merge/Close, and Time to Deploy, broken down by team, author, repository, and ticket type so you can pinpoint exactly where time is going
Four Pillars framework – cycle time sits within the Speed pillar, but Plandek tracks Focus, Predictability, and Quality alongside it, so improvements in one dimension don't come at the expense of the others
50+ second-order metrics – flow efficiency, PR collaboration, bug resolution time, deployment patterns, and more; the metrics that explain what's actually moving your headline numbers up or down
AI tool impact tracking – measures the adoption and delivery impact of tools like Copilot, Cursor, and Devin, showing whether AI is improving cycle time at the system level or simply accelerating entry into the next bottleneck
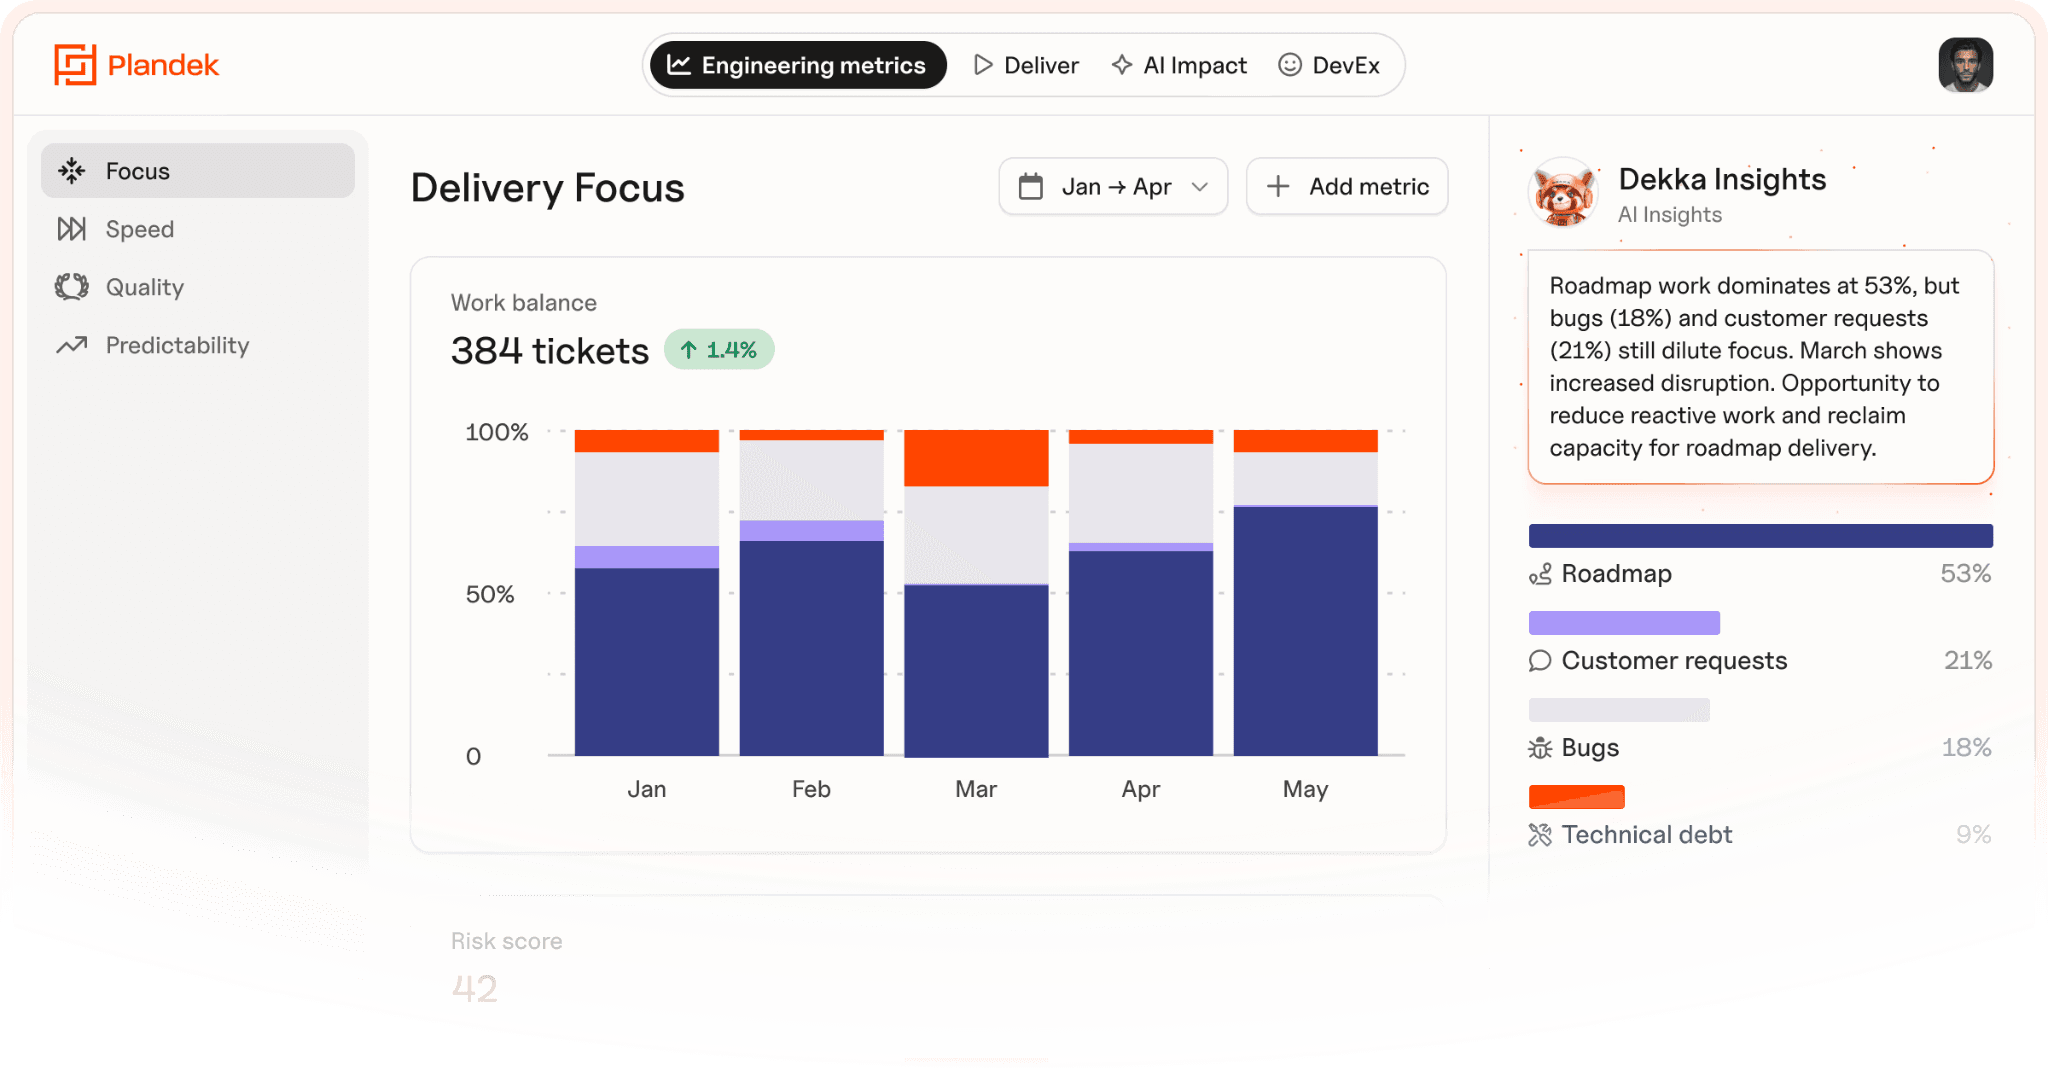
Dekka, Plandek's AI Delivery Assistant – surfaces risks, blockers, and recommended actions from your delivery data automatically, without anyone having to dig for them
Integrations across your existing stack – connects Jira, GitHub, GitLab, Azure DevOps, and most CI/CD tools, with data syncing automatically to keep dashboards current
Cycle time improvement isn't a one-time fix – it's an ongoing process of identifying constraints, removing them, and measuring the result. Plandek gives engineering leaders the visibility to do that systematically, across the whole delivery system.
Book a demo to see it in action.
Key Takeaways
Cycle time measures active development to deployment, not from when work was requested or planned
Sub-components reveal more than the headline number – review time, approval time, and deploy time each point to different fixes
Elite teams run under 6.6 days, but batch size makes benchmarks misleading; directional improvement matters more
Organizational causes drive more cycle time inflation than technical ones – dependencies, context switching, and work swapping are the real culprits
AI exposes bottlenecks rather than removing them – high AI adoption has been linked to a 91% increase in PR review time
Cycle time is a Speed metric – Speed is only one of four pillars – without Focus, Predictability, and Quality, optimizing it can degrade the wider system
FAQs
What is a good cycle time for software engineering teams?
High-performing teams typically achieve cycle times of 6.6 days, according to research by Plandek. The most useful benchmark is your own trend over time – consistent reduction matters more than hitting a specific number.
What is the difference between cycle time and lead time?
Cycle time measures from when work starts; lead time measures from when it is requested. Lead time is always equal to or longer than cycle time, and typically exposes delays in backlog management and approval workflows that cycle time misses.
What is the difference between cycle time and DORA's lead time for changes?
Lead time for changes is a DORA metric that measures specifically from code commit to production deployment, focused on pipeline efficiency. Cycle time is broader, covering the full span from work starting to production, including development and review time.
What causes high cycle time in software teams?
The most common causes are large batch sizes, slow PR review processes, high work in progress, unreliable CI/CD pipelines, and cross-team dependencies. Diagnosis before intervention is essential – the same cycle time number can have very different root causes.
How does AI adoption affect cycle time?
AI tools can accelerate coding and increase PR volume, but if review processes don't scale with the additional output, cycle time can increase even as individual developer speed improves. Measuring cycle time sub-components helps distinguish genuine gains from shifted bottlenecks.
Written by
Charlie Ponsonby
Co-founder & CEO
Charlie Ponsonby is CEO and Co-founder of Plandek, the leading Developer Productivity Insight (DPI) platform that helps software engineering teams drive productivity and transition to AI-led engineering. He writes widely on the opportunities and challenges inherent in the transition to the agentic SDLC. Prior to founding Plandek, Charlie founded Simplydigital, which grew to become the UK's largest broadband and digital services comparison business before being acquired by Europe's largest consumer electronics retailer. He started his career at Accenture and has held senior leadership roles in retail and telco. Charlie holds a degree from the University of Cambridge.


See how your engineering efforts translate into measurable business impact
Measure delivery performance, AI impact, and engineering productivity with hundreds of metrics, OOTB dashboards and custom configurations.


Contact us
UK Office
Unit 313 The Print Rooms, 164-180
Union St, London SE1 0LH
US Office
Floor 4, 1515 Mockingbird Ln,
Charlotte, NC 28209, USA