


This article is from our archives. Browse our articles to see what we’re talking about now, or take a look at what Plandek can do to improve software delivery and enable your AI transition today.
How can you reap the rewards of a ‘bottom-up’ approach while avoiding the perils of a ‘top-down’ approach?
The Value Stream Management revolution is turbo-charging the recognition that Agile software delivery requires the measurement (and management) of the value delivery process in its entirety - from ideation to live. Only then can you track and accelerate the delivery of value to customers.
However, measuring the end-to-end value delivery process is tricky - both in terms of which metrics to select and how to embed their usage for a positive effect. Too often, a ‘top-down’ approach is led by technology leadership in order to ‘impose’ Value Stream Metrics (or agile delivery metrics) on teams that have not bought into the process.
As a result, the Value Stream Metrics, at best, gain little traction and at worst, alienate the hard-working delivery teams upon which the success of the delivery organisation depends.
Implementing an effective metrics-led approach
Gartner’s latest research forecasts that 70% of all organisations will adopt a Value Stream Management (VSM) approach to software delivery by 2023 (Source: Gartner November 2021).
The VSM framework requires organisations to identify (or 'map') the key ‘value streams’ and then apply analytics and orchestration to manage value delivery from ideation to live, within and across value streams. In short, a metrics-led approach to Agile software (value) delivery is essential for a successful VSM model.
As the graphic below shows, a successful bottom-up approach to metrics-led value delivery can result in quite a dramatic improvement in key-value delivery metrics such as Time to Value, Deployment Frequency, Flow Efficiency and Sprint Accuracy.
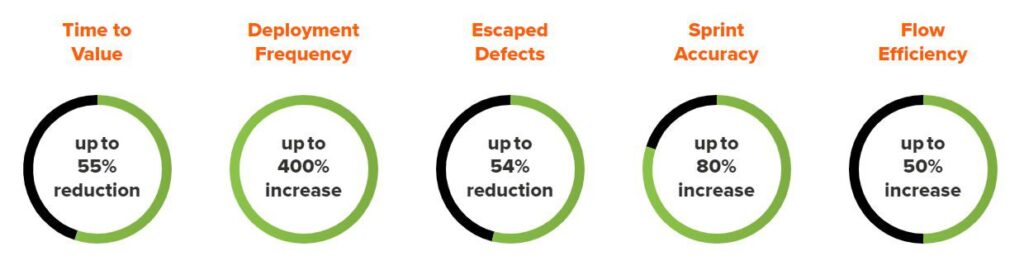
Improvement in key agile metrics was achieved by applying a metrics-led approach to software delivery - source: Anonymised Plandek client data.
Choosing Value Stream Metrics
So, what Value Stream Metrics/agile delivery metrics should you choose?
Measurement of effective value delivery can be provided by a whole range of Value Stream Metrics, Agile metrics, delivery metrics, engineering metrics, DevOps metrics, DORA metrics, flow metrics and more. Indeed, there is no shortage of software delivery metrics to choose from.
Plandek’s research shows that as a result of the sheer volume of software delivery measures, most delivery organisations are not confident in selecting delivery metrics and benefit from delivery metrics tools that provide out-of-the-box dashboards with value stream, agile delivery and engineering metrics pre-selected to solve key delivery challenges. The popularity of Plandek Xcelerator dashboards is a testament to that.
So, with a bit of background reading and help from value stream analytics tools like Plandek, it is relatively easy to settle on a sensible set of value stream/Agile delivery metrics that are suited to your objectives and the challenges your organisation faces.
The perils of a ‘top-down’ approach when introducing Value Stream Metrics
Very often, Value Stream Management initiatives and the related desire to get a better view of the end-to-end value delivery process (via metrics and analytics) are initiated by technology leadership. As such, the temptation is to roll out a range of value stream/agile delivery metrics via a ‘top-down’ framework.
All of our experience shows this is very unlikely to succeed because:
Metrics only work (and lead to better outcomes) if they are broadly adopted, valued and trusted. If scrum teams (squads) and Team Leaders are not involved in metric selection, it is highly likely that they will be ignored, resented and distrusted. Indeed, the ‘big brother is watching you' approach is completely contrary to the spirit of decentralised, self-determining teams working in an Agile way and will quite rightly be resoundingly rejected by most, if not all teams.
It is vital that teams are closely involved in metric collection. Agile delivery metrics can quickly become inaccurate if teams are not constantly managing the metrics configuration to ensure they match the constantly changing workflows and processes at work.
So, a top-down approach is likely to:
alienate teams
generate inaccurate metrics
do more harm than good
The advantages of a ‘bottom-up’ approach to Value Stream Metrics
It is no surprise that the Plandek team is a big fan of a ‘bottom-up’ approach to value stream and agile delivery metrics. All of our experience with clients globally shows this to be a much more effective approach.
Though the ‘bottom-up’ approach still tends to be led by technology leadership, it heavily involves teams in the selection and implementation of value stream/agile delivery metrics from the outset.
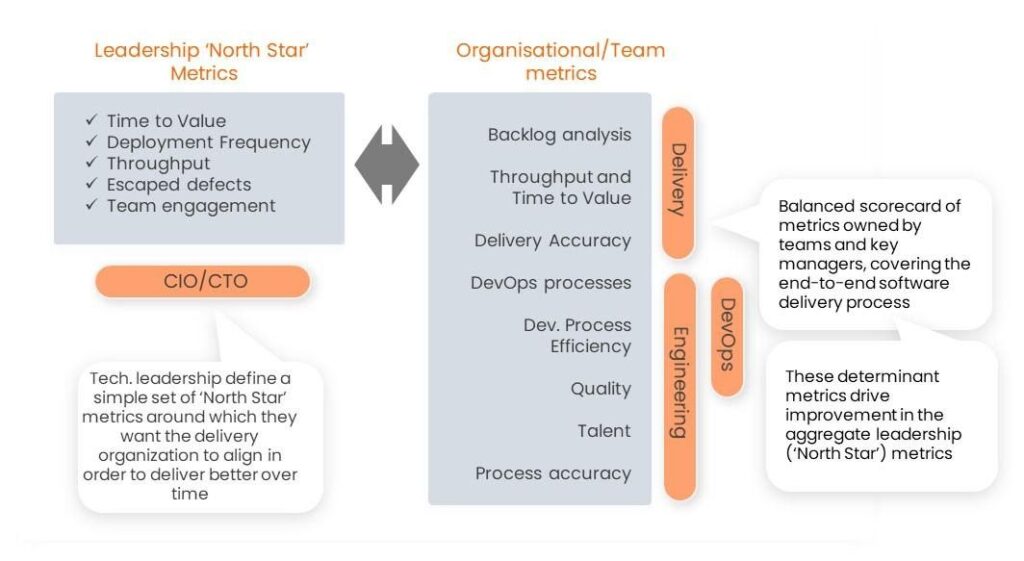
Technology leadership are always involved: the bottom-up approach naturally requires the leadership team to agree on a set of ‘North Star’ value delivery metrics that are relevant for the entire organisation. Following that, the leadership team then works with managers and Team Leaders to agree on a set of determinant metrics owned by teams and managers that drive improvement in the agreed overall ‘North Star’ metrics.
However, this bottom-down approach requires a delivery metrics/analytics platform that is capable of providing highly customisable Value Stream metrics dashboards for use by all the key personas – from Team Leaders (with their own team-level views) to Delivery Managers and Product Managers and all the way to the C-Suite.
The example below shows a Plandek team metrics dashboard, including sprint completion metrics owned by the team, which are part of an organisation-wide VSM initiative to improve value delivery.
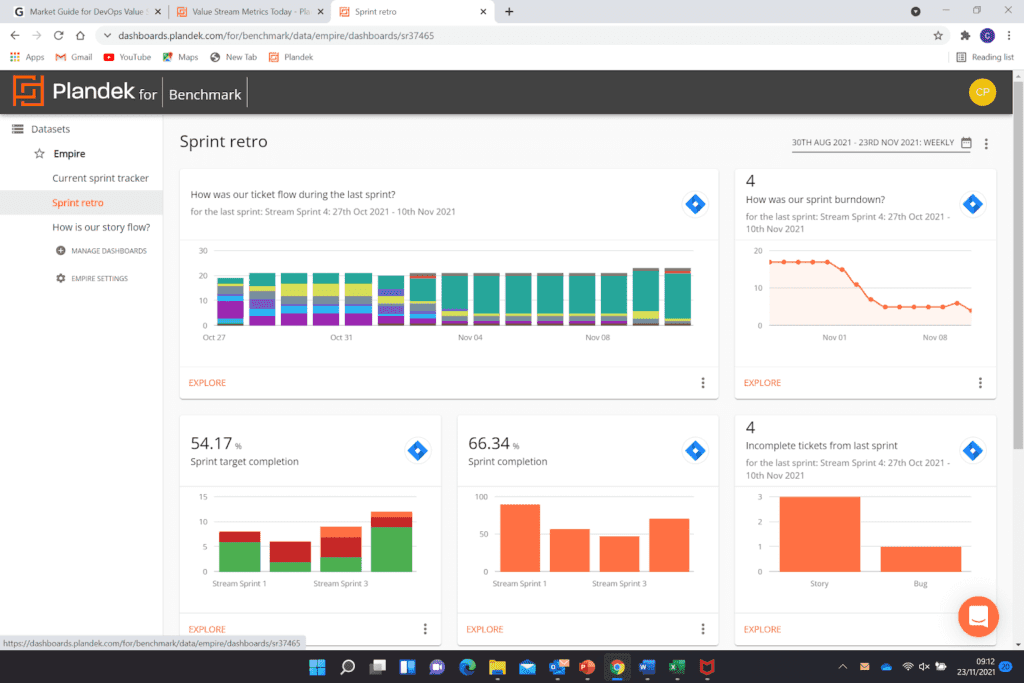
Example Team level agile metrics dashboard – showing sprint completion metrics
Key takeaways
In summary, our experiences with clients across the industry and the globe show:
Value Stream Management (VSM) is gaining traction within Agile DevOps: empirical data shows that it can significantly improve value delivery.
Gartner forecasts that 70% of all organisations will adopt a VSM approach by 2023.
End-to-end Value Stream Metrics (and related Agile metrics)are central to the concept of Value Stream Management – so that the delivery of value is managed from ideation to live.
Implementing VSM metrics can effectively deliver continuous improvement in key Value Delivery Metrics such as Cycle Time, Time to Value, Deployment Frequency and Sprint Accuracy.
Taking a ‘bottom-up’ approach that proactively involves teams and Team Leaders from the outset is key to successfully implementing Value Stream Metrics.
Value Stream Metrics platforms like Plandek underpin and enable this bottom-up approach and enable organisations to agree on – and track – a set of delivery metrics that set the overall direction for improving value delivery.
About Plandek
Plandek was co-founded in 2017 by Dan Lee (founder of Globrix) and Charlie Ponsonby (founder of Simplifydigital).
Plandek is an analytics platform to help software delivery teams deliver valuable software faster and more predictably – across and within value streams.
Plandek works by mining data from delivery teams’ toolsets (such as issue tracking, code repos and CI/CD tools) to provide actionable and intelligent insight across the end-to-end software delivery process.
Written by
Charlie Ponsonby
Co-founder & CEO
Charlie Ponsonby is CEO and Co-founder of Plandek, the leading Developer Productivity Insight (DPI) platform that helps software engineering teams drive productivity and transition to AI-led engineering. He writes widely on the opportunities and challenges inherent in the transition to the agentic SDLC. Prior to founding Plandek, Charlie founded Simplydigital, which grew to become the UK's largest broadband and digital services comparison business before being acquired by Europe's largest consumer electronics retailer. He started his career at Accenture and has held senior leadership roles in retail and telco. Charlie holds a degree from the University of Cambridge.


See how your engineering efforts translate into measurable business impact
Measure delivery performance, AI impact, and engineering productivity with hundreds of metrics, OOTB dashboards and custom configurations.


Contact us
UK Office
Unit 313 The Print Rooms, 164-180
Union St, London SE1 0LH
US Office
Floor 4, 1515 Mockingbird Ln,
Charlotte, NC 28209, USA