


Most engineering leaders already have Agile metrics in place. Velocity, cycle time, deployment frequency – the usual suspects. The problem is that, when they’re not understood as an ecosystem, they're quietly lying to you about whether work is really delivering value.
Agile metrics only work as a system.
In this article, we explain what metrics are available, how to choose them and how to measure them.
What are Agile metrics?
Agile metrics are measurements that help teams track delivery performance, identify bottlenecks, and continuously improve software development processes.
Unlike traditional project management metrics that focus on sticking to plans, Agile metrics emphasize flow, adaptability, and continuous improvement..
The right metrics depend on your organization's goals and context:
If you’re a FinTech startup you might prioritize speed and deployment frequency
Enterprise healthcare platforms may prioritize reliability and compliance
Teams mid-scaling may need to focus on predictability
Different Agile frameworks also emphasize different measurements. Scrum centers on velocity, sprint burndown, and planned vs. actual delivery. Kanban prioritizes cycle time, throughput, and WIP. Lean focuses on lead time, waste reduction, and deployment frequency. Some metrics – escaped defects, flow efficiency, code quality – cut across all of them.
Your job is to choose the metrics that answer the right questions for where your team is right now.
Agile Metrics by Framework
Different Agile frameworks emphasize different metrics – but the underlying questions they're trying to answer are largely the same.
Scrum metrics: Scrum centers on sprint-level planning and delivery. The metrics that matter most focus on whether the team can commit reliably and deliver consistently within a fixed cadence.
Kanban metrics: Kanban focuses on flow. Flow metrics surface where work is moving, where it's waiting, and where the system is constrained.
Lean metrics: Lean emphasizes end-to-end efficiency and waste reduction. We’re tracking how long value takes to travel from request to delivery, and how much of that time is genuinely productive.
But not all metrics are important at a leadership level. We’re going to focus on what should matter for ensuring work leads to value.
Four types of Agile metrics
High-performing Agile teams track Agile delivery metrics across four distinct dimensions, and they watch how those dimensions interact.
We call these the Four Pillars of Software Engineering Productivity, developed by Plandek from research across 2,000+ engineering teams.
Rather than organizing metrics by methodology, the Four Pillars organize them by what the metric actually tells you about your delivery system. A Scrum team and a Kanban team will track different metrics within each pillar, but they're answering the same four questions.
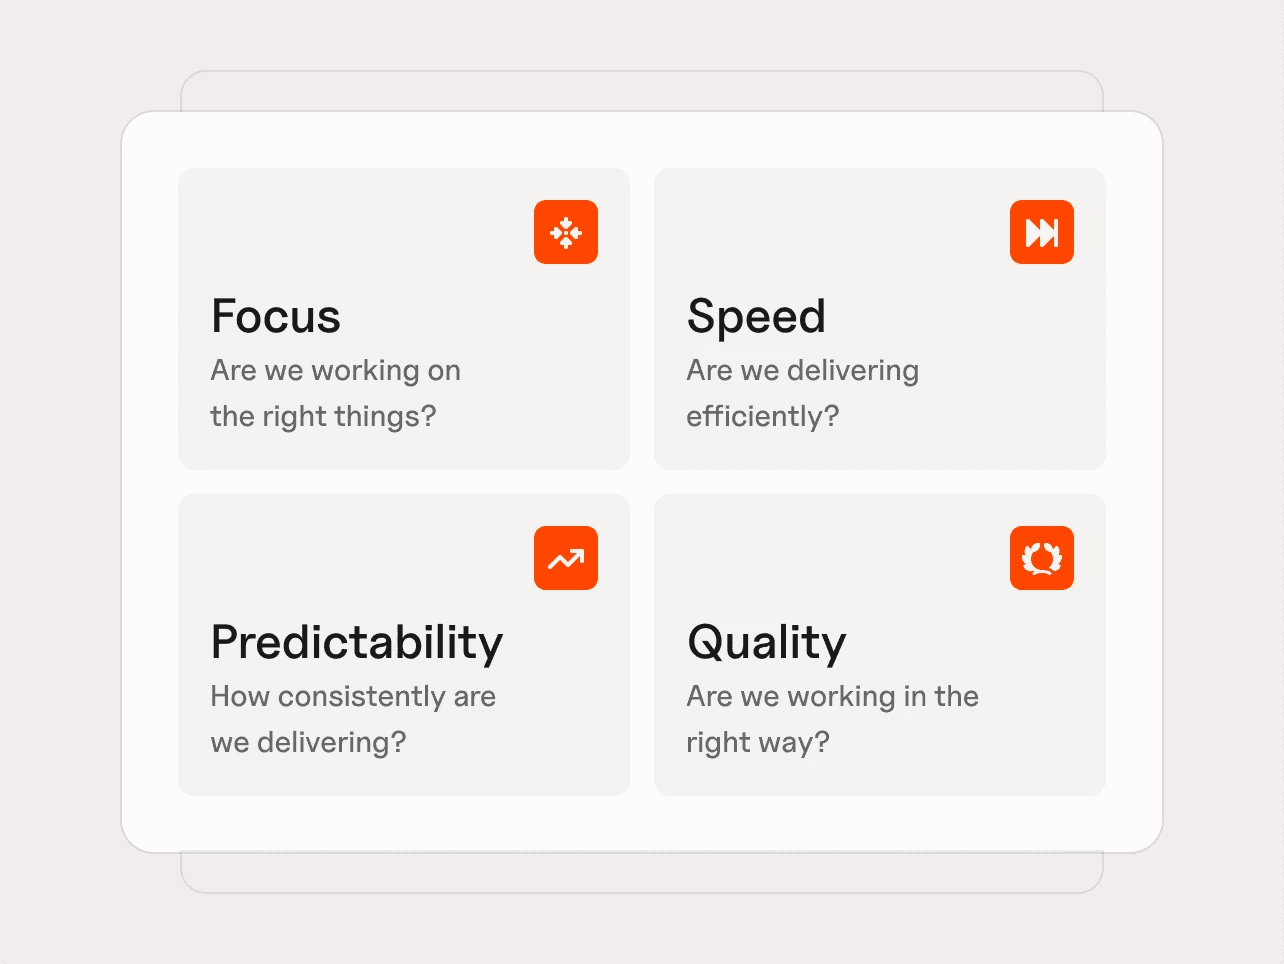
Pillar 1: Focus – are we working on the right things?
The first question any Agile team should be able to answer is whether engineering effort is actually going toward value-creating work.
This is easy to overlook when velocity looks healthy. But if a team is spending the majority of its capacity on bugs, incidents, and maintenance, output metrics will flatter to deceive. Research across our benchmark data shows low-performing teams spend as little as 20% of capacity on roadmap work. When reactive work dominates, delivery slows regardless of how fast the team moves.
Value Delivery %
The proportion of work contributing directly to roadmap outcomes. The single most important signal of whether engineering effort is pointed in the right direction.
👉 Expert tip: Low-performing teams spend as little as 20% of capacity on roadmap work. If this number is low, improvements in speed and predictability will have limited business impact.
Support & Maintenance %
Capacity consumed by bugs, incidents, and upkeep. When reactive work dominates, delivery slows regardless of how fast the team moves.
👉 Expert tip: Track this alongside Value Delivery % as a pair – together they show whether the team is running to stand still or genuinely moving forward.
Planned vs. Unplanned Work %
How much capacity is being consumed reactively. High unplanned work undermines sprint planning and erodes predictability over time.
Pillar 2: Speed – how efficiently does work move?
Speed in Agile is about how efficiently work flows through the entire delivery system – not how fast code gets written. Most delays don't happen during development; they happen in waiting: queues, reviews, approvals, and releases.
Cycle Time
Time from work starting to production. A core indicator of delivery efficiency and workflow health. Track distribution rather than averages – high variation signals estimation problems or scope creep, not just slowness.
👉 Expert tip: High-performing teams review cycle time regularly to catch anomalies early, before they compound into delivery risk.
Learn more about Cycle Time and how to reduce it
Lead Time to Value
Time from idea to production. Lead Time to Value is often 5x longer than cycle time, making it the single biggest opportunity for delivery improvement across the SDLC.
👉 Expert tip: Top-performing teams achieve under 22.5 days – teams that get there do so by optimizing the full pipeline, not just development speed.
Work in Progress (WIP)
How many tasks are actively in flight at once. High WIP creates context switching, congestion, and longer cycle times. Teams enforcing WIP limits can reduce bottlenecks significantly. If velocity stays constant but WIP rises, something is slowing the team down.
Throughput
The number of work items completed in a given time period – tickets closed per sprint, features shipped per week, stories delivered per iteration. Throughput reveals overall team capacity and is one of the most widely tracked Agile flow metrics.
We recommend focussing on Throughput Quotient, not Throughput. The limitation of raw throughput is that it measures volume without context. A team that doubles throughput by shipping smaller, lower-complexity items looks more productive on paper without actually delivering more value.
Throughput Quotient
Throughput normalized by team size and cycle time. Where raw throughput measures how much is being shipped, Throughput Quotient measures how efficiently the team is actually operating – stripping out the effect of team size and delivery speed so you can see whether genuine productivity is improving.
👉 Expert tip: Breaking this metric into its core components surfaces specific workflow inefficiencies that a headline throughput number will hide. If throughput rises but cycle time balloons, you're likely shifting pressure downstream rather than improving the system.
More speed metrics to know about
Flow Efficiency
The percentage of elapsed time work is actively being worked on vs. waiting. Many teams discover that work spends 80–85% of its lifecycle waiting. This can be one of the most sobering metrics in any Agile audit.
Cumulative Flow Diagram (Kanban)
A system-level view of how work is moving – or stacking up – across delivery stages over time. Leaders don't need to read it daily, but it's the most useful visualization for understanding where a bottleneck.
Deployment Frequency
How often teams release to production. One of the four DORA metrics, and a strong signal of CI/CD maturity and release health.
Speed metrics are the most commonly tracked Agile metrics – and the most commonly misread. Improving cycle time while WIP rises and flow efficiency falls is not an improvement. It's pressure being applied to a constrained system.
Pillar 3: Predictability – do we plan reliably?
Predictability measures whether teams deliver consistently against what they commit to. Without it, sprint planning becomes guesswork, roadmap commitments become unreliable, and stakeholder trust erodes.
Velocity
Story points completed per sprint. Velocity is not a performance metric and should never be compared across teams – story point scales differ and context varies too much. What matters is consistency over time. A team delivering 30 points reliably is in better shape than one swinging between 20 and 60.
Sprint Target Completion
Percentage of committed work delivered within the sprint. The clearest single signal of planning and execution quality.
👉 Expert tip: High-performing teams sustain 80–90% completion. Below that threshold, look first at mid-sprint scope change and carryover rate.
Sprint Capacity Accuracy
Total sprint velocity divided by initial commitment. Reveals how accurately teams understand their own delivery capacity – and whether sprint planning reflects reality or optimism.
👉 Expert tip: This is one of the most honest predictability metrics available. Teams that track it consistently improve their planning reliability over time.
Mid-Sprint Scope Change %
How much work is added or removed during a sprint. High levels undermine predictability and point to planning or prioritization problems upstream.
👉 Expert tip: The top 25% of teams target 58% and below. Reducing this metric is often more impactful than improving velocity.
Velocity Volatility
How stable delivery is over time. High volatility signals inconsistency and delivery risk – even when average velocity looks acceptable.
👉 Expert tip: Teams with high velocity volatility often have an underlying scope or estimation problem, not a capacity problem. Fixing the wrong thing here is a common mistake.
PR Efficiency Quotient
How effectively PRs convert into merged output. Highlights collaboration quality and review bottlenecks.
👉 Expert tip: Teams that improve this metric often do so by breaking work into smaller PRs – easier to review, faster to merge, and more likely to catch bugs before they escape.
Merge Frequency per Author
How often engineers integrate changes. Higher frequency means smaller changes, faster feedback, and fewer conflicts – a strong signal of CI/CD discipline and collaborative workflow health.
👉 Expert tip: Low merge frequency is often a symptom of oversized PRs or unclear ownership – both of which inflate cycle time and review latency.
More predicability metrics to know about
Carryover Rate
Stories not completed in a sprint that carry into the next. One of the most honest signals of sprint health and planning quality, and one of the most underreported metrics in the industry.
Sprint Burndown (Scrum)
Remaining work vs. time left in the sprint. Useful for in-sprint visibility but should always be interpreted alongside cycle time and velocity, not as a standalone success indicator.
Epic Burndown
Progress toward a large initiative across multiple sprints. Useful for forecasting delivery of major work, but flat lines and late sharp drops often signal scope reduction rather than genuine acceleration.
Pillar 4: Quality – Are we delivering sustainably?
Quality metrics answer the question that speed metrics can't: is this pace sustainable, or are we creating future work? Quality metrics make that tradeoff visible before it becomes a customer problem.
Escaped Defects
Defects that make it through the development and testing process and reach users. One of the few Agile quality metrics that measures whether your testing process actually works, rather than just whether it runs. The most useful definition extends beyond production: an escaped defect is any defect found after the development team has declared the work done.
Learn more about Escaped Defects
Escape Rate
Escaped defects as a proportion of total defects. Benchmarks: under 10% is excellent; 10–20% is good; 20–40% is concerning; above 40% indicates a broken QA process.
Bug Resolution Time
Time to fix defects once found. Longer resolution times increase the defect backlog, reduce available capacity, and slow future delivery compounding over time.
👉 Expert tip: Rising bug resolution time is often a leading indicator of team overload – the backlog grows faster than capacity can absorb it.
Stories Delivered : Bugs Raised
Whether new work is introducing defects at a healthy rate. As velocity increases, this ratio is one of the earliest signals that quality is being traded for speed.
👉 Expert tip: Analyze as a converging or diverging pair with Bugs Resolved : Bugs Raised – together they tell a story that neither metric tells alone.
Bugs Resolved : Bugs Raised
Whether teams are keeping pace with defect load or accumulating debt. A diverging ratio here is one of the clearest early warnings of unsustainable delivery pace.
👉 Expert tip: Top-performing teams resolve as many bugs as they raise, or better. Teams below this threshold are building a quality problem that will eventually surface as escaped defects.
Code Review Time / Time to Merge PRs
Tracks review and integration latency. Slow review queues are one of the most common hidden drags on both delivery speed and quality.
👉 Expert tip: This metric typically accounts for 20–30% of cycle time. Teams that get under 24 hours see significantly faster delivery and fewer merge conflicts.
More quality metrics to know about
Work Item Age
How long tasks have been in progress. Highlights stale work and flags items at risk of becoming blocked.
Blocked Time
How long work items remain in a blocked state. Surfaces external dependencies, process bottlenecks, and unresolved technical issues.
Quality metrics are the most neglected pillar in most Agile measurement programs – and the one most likely to expose what output metrics are hiding.
How to choose Agile metrics
Focus on delivery challenges, not the longest list of available metrics.
Chaotic releases → start with Deployment Frequency and Lead Time
Slow delivery → start with Cycle Time and WIP
Unpredictable sprints → start with Velocity Volatility and Sprint Target Completion
Quality degrading as output rises → start with Escaped Defects and Bugs Resolved : Bugs Raised
For most engineering teams, however, the better starting point is a framework rather than individual metrics. The Four Pillars of Engineering Productivity – Focus, Speed, Predictability, and Quality – were developed from research across 2,000+ engineering teams and are designed to give an immediately balanced view of delivery health.
The Four Pillars select core metrics from those above, give you a proven structure from day one, covering the dimensions that matter most without over-indexing on any single signal.
Plandek tracks all Four Pillars metrics – and many more – out of the box, so you can start measuring what matters without manual setup or custom instrumentation.
Make Agile metrics actionable with Plandek
You need more than just a few metrics. You need insights into how your metrics interplay, and actionable insights, especially when AI tools are changing how work flows through your SDLC.
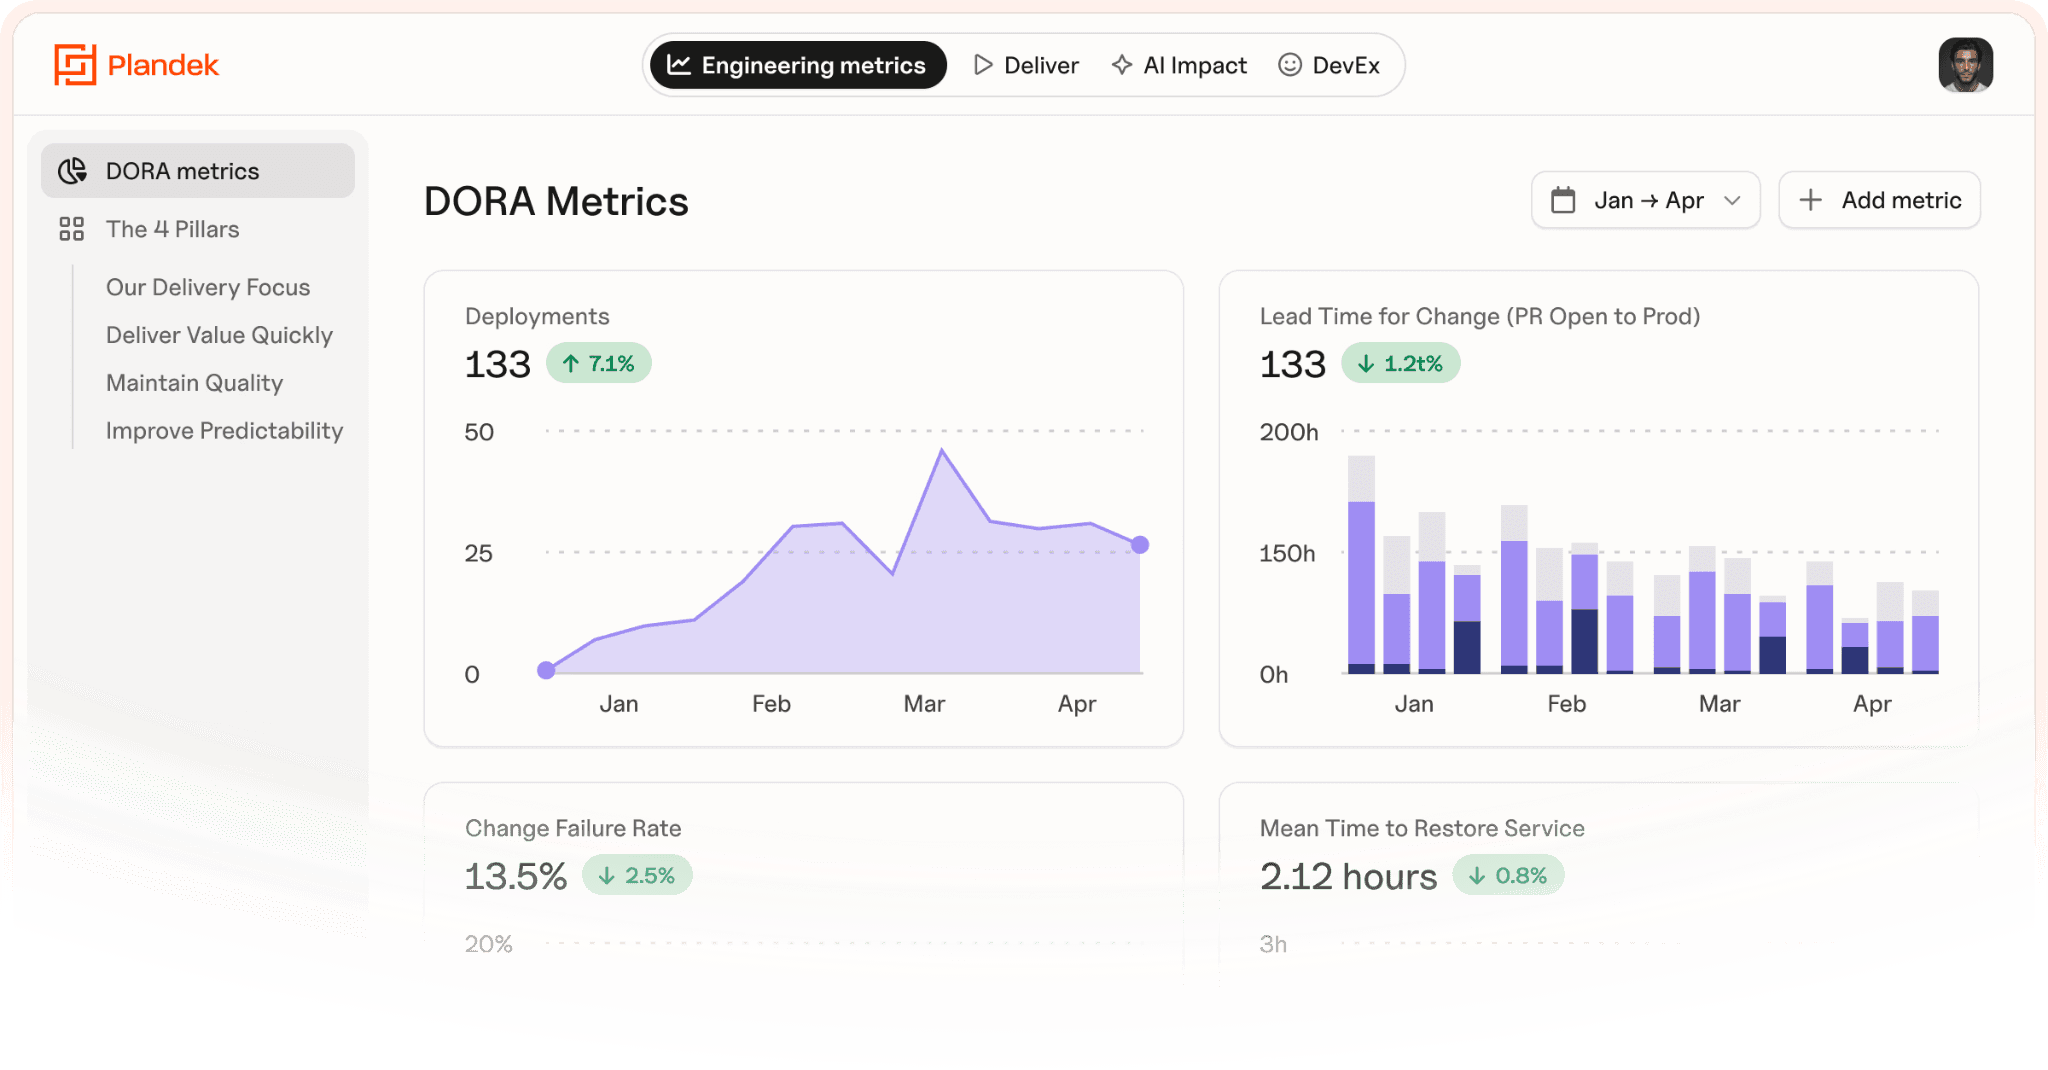
Plandek's award-winning Developer Productivity Intelligence platform organizes Agile metrics across the Four Pillars of Software Engineering Productivity – Focus, Speed, Predictability, and Quality – alongside 50+ second-order Agile metrics. This gives your engineering leaders a system view of delivery performance rather than a collection of isolated numbers.
With Plandek, you will have access to:
Actionable metrics, out-of-the-box: Plandek comes with dashboards that track all the core Agile metrics. You can slice the data by team, department, or the whole org.
50+ metrics that explain the why: With dozens of second-order metrics available like cycle time, PR collaboration and flow efficiency, you will always know how your software delivery is performing.
Identify and fix bottlenecks: With the power of Plandek’s AI assistant, Dekka, you can surface the constraints behind the numbers – not just what is off, but where and why
Measure AI adoption: Plandek shows you the impact of AI tools Cursor, Copilot, and Devin, including how teams are adopting tools and how they are affecting your SDLC.
Share understandable KPIs: Give stakeholders the insights they need, connecting engineering performance to business outcomes
Integrates with the tools you use: Plandek integrates with with Jira, GitHub, GitLab, Azure DevOps, and most CI/CD tools. Data syncs automatically, so your dashboards stay current without extra work.
Plandek offers best-in-class flexibility. Metrics, dashboards, workflows, team structures, and reporting can all be shaped around how your organization actually operates.
If you want to see it in action, go ahead and book a demo.
Key Takeaways
Agile metrics work as a system – tracking speed alone while ignoring quality, focus, and predictability is how teams get blindsided
Four dimensions give structure: Focus, Speed, Predictability, and Quality – push hard on one without watching the others and something else degrades
Activity is not delivery – more commits, more PRs, and higher velocity only matter if they translate into reliable, valuable output
Escaped defects are the quality metric that matters most – they measure whether your testing process works, not just whether it runs
Teams should own their metrics – imposed metrics get gamed; chosen metrics drive improvement
FAQs
What are the most important Agile metrics?
The most important agile metrics span four dimensions: Focus, Speed, Predictability, and Quality. Key metrics include Value Delivery %, Cycle Time, Lead Time to Value, Sprint Target Completion, Velocity, and Escaped Defects. No single metric tells the full story – the teams that improve fastest track metrics across all four dimensions, watching how they interact rather than optimizing any one in isolation.
What are DORA metrics and how do they relate to Agile metrics?
DORA metrics – Deployment Frequency, Lead Time for Changes, Change Failure Rate, and Mean Time to Restore – measure DevOps and release performance. They overlap with Agile metrics but originate in DevOps research. High-performing Agile teams typically track DORA metrics alongside sprint and flow metrics for a complete picture.
Written by
Ruth Dillon-Mansfield
Growth Partner
Ruth has 10 years' experience in growth leadership in the tech industry. She has served as COO at a FTSE-listed company, and works with tech start-ups and scale-ups to help their customers understand how to realize value from their products.


See how your engineering efforts translate into measurable business impact
Measure delivery performance, AI impact, and engineering productivity with hundreds of metrics, OOTB dashboards and custom configurations.












NEW
Contact us
UK Office
Unit 313 The Print Rooms, 164-180
Union St, London SE1 0LH
US Office
Floor 4, 1515 Mockingbird Ln,
Charlotte, NC 28209, USA