


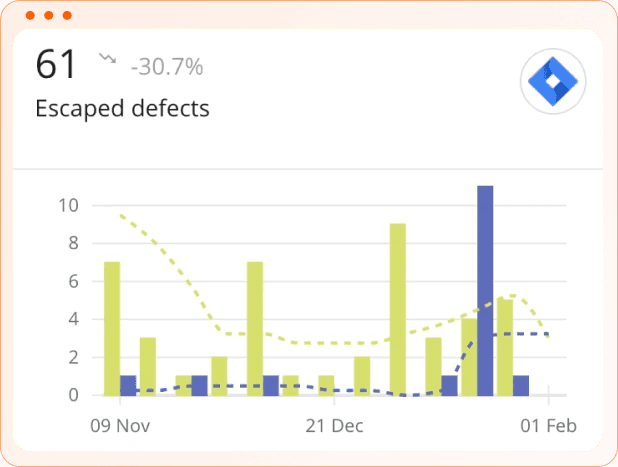
What are Escaped Defects?
Escaped Defects are defects that make it through your development and testing process and reach users in production. It is a core Agile quality metric, and is a core objective of effective Agile DevOps.
Every team produces Escaped Defects. The question is how many, how severe, and whether you understand why.
A stricter and more useful definition extends this slightly: an escaped defect is any defect found after the development team has declared the work done. That means anything surfaced in QA, UAT, staging, or production counts – not just the bugs your users find.
This sets a higher bar, but it's the right one. The later a defect is found, the more it costs.
Why Escaped Defects matter more than most quality metrics
Most QA metrics measure activity. Test count, coverage percentage, bug volume – these reward process compliance, not process effectiveness.
Escaped Defects measure whether your testing process actually works.
There is also a cost argument that is easy to understate. The cost of fixing a defect does not just double the later it is found – it increases non-linearly. Each downstream environment adds its own test code, its own retesting cycle, its own remediation overhead. A defect caught in production may require rebuilding both functional and test code across multiple stages. The further right it escapes, the more backflow it creates.
Legal exposure and reputational damage sit at the far end of that cost curve. For most teams, the financial and trust cost of production defects is the most visible consequence of a weak QA process.
The quality/velocity tradeoff
One reason Escaped Defects deserve close attention is that they tend to get worse exactly when teams feel like they are performing well.
As velocity increases – more story points delivered, faster cycle times, shorter release windows – quality pressure intensifies.
The number of Escaped Defects can rise quietly while output metrics look healthy.
This is one of the most common failure patterns in scaling engineering teams, and it is why escaped defects should always be tracked alongside velocity metrics like Story Points Delivered and Cycle Time, not in isolation.
How to measure Escaped Defects
The standard Escaped Defects rate formula is:
Escape rate = production defects / (production defects + pre-production defects)
Measure this per release or per month, calculated retroactively once defects are categorized.
Benchmarks to work with:
Under 10% – excellent
10–20% – good
20–40% – concerning
Above 40% – broken
Most teams without deliberate QA investment sit in the 30–50% range. Getting below 20% takes focused work.
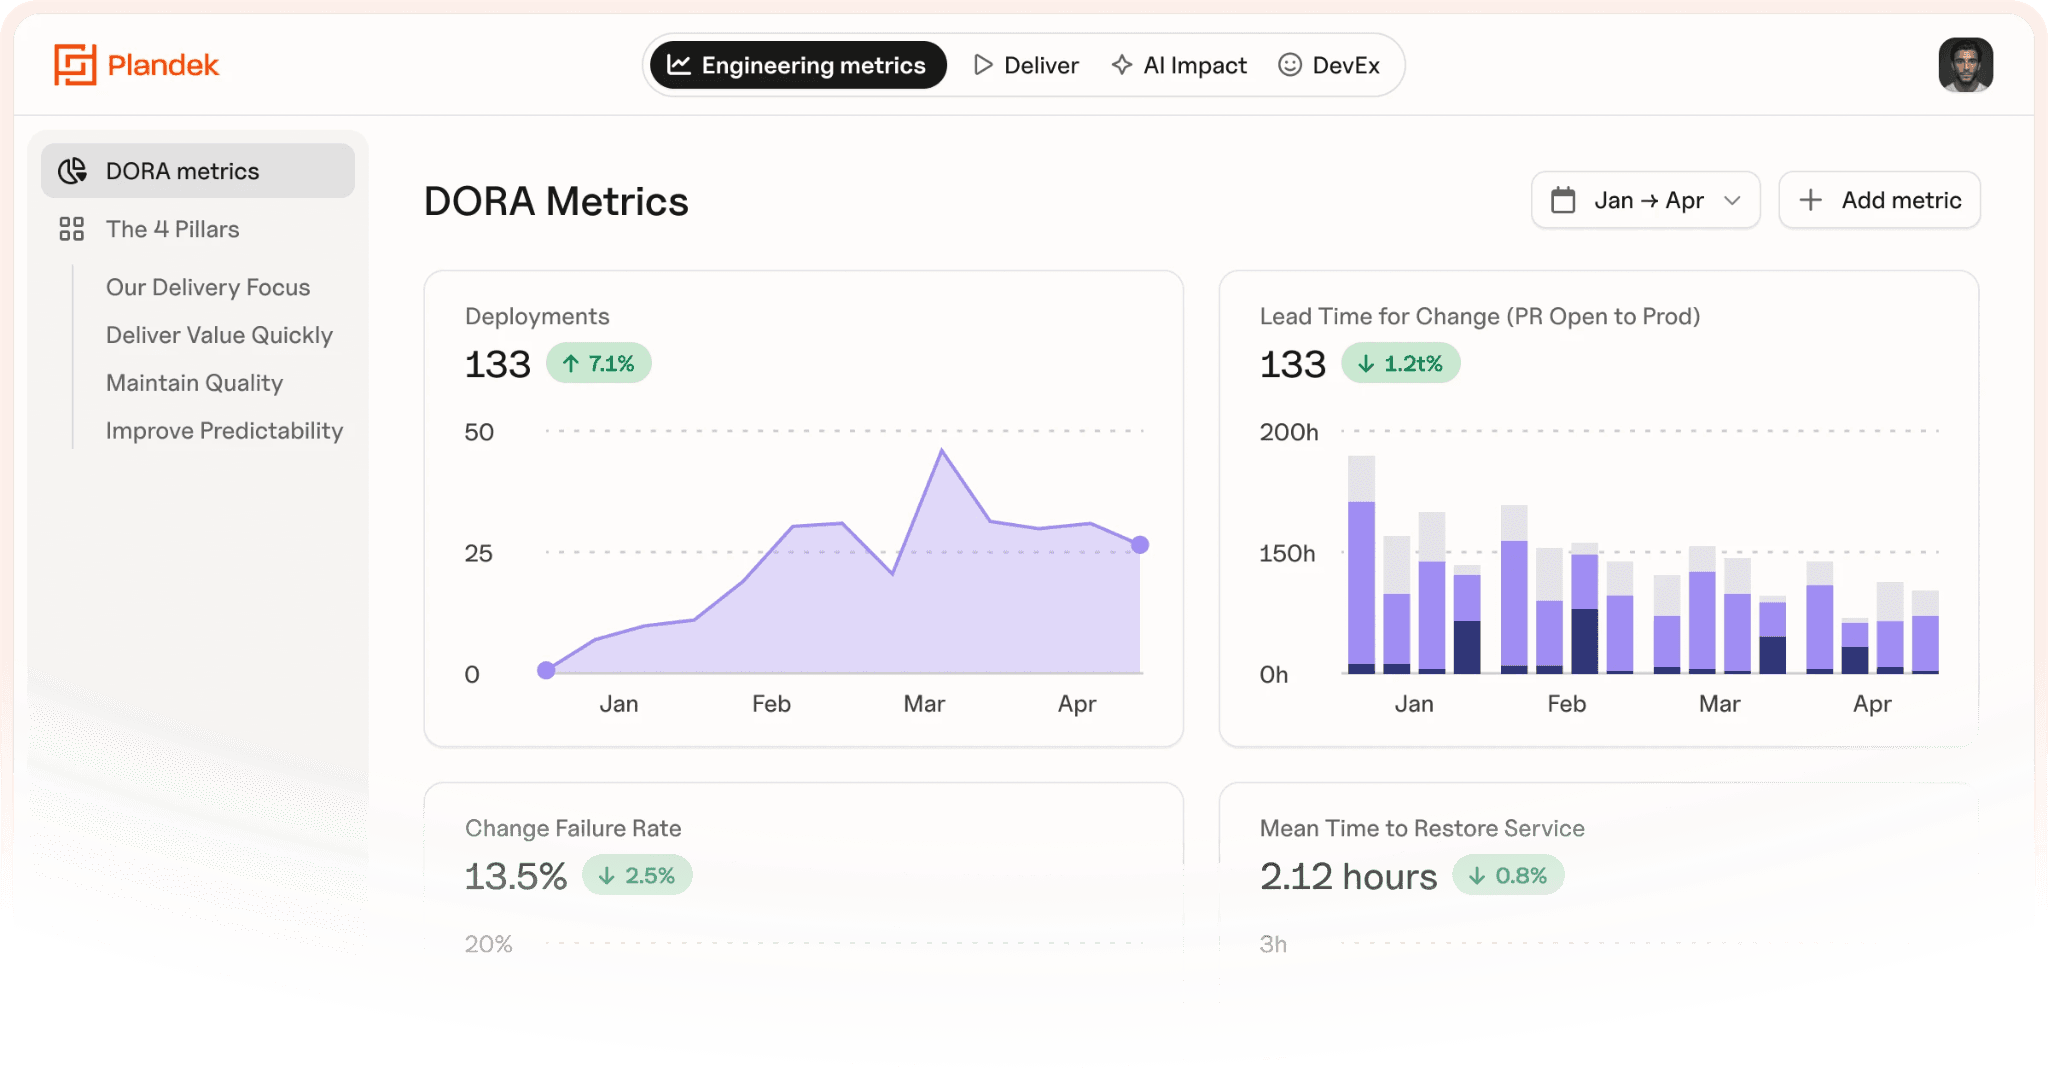
Delivery metrics dashboards like Plandek enable you to analyze delivery, engineering and DevOps metrics in several different ways.
Using Plandek’s platform, you can analyze the type of Escaped Defect by source, along with a wide range of actionable software delivery and DevOps metrics. With Plandek, defect escape can be sorted by priority, and by programme.
Two refinements make the metric more useful:
Weight by severity. A 10% escape rate made up entirely of P0 defects is far worse than a 30% rate of P3s. Track severity distribution alongside the headline number.
Break down by feature or team. Which areas of the product escape the most defects? This surfaces coverage gaps and workflow differences that an aggregate number hides.
One important caveat on team-level tracking: ranking teams against each other on escape rate creates incentives to under-report bugs or inflate the pre-production denominator with trivial issues. Use per-team trend data to spot improvement or deterioration, not to create league tables.
What drives Escaped Defects?
Three root causes account for the majority of escapes, and each requires a different response.
Coverage gaps. Tests simply do not exist for the area where the bug occurred. The fix is requirements-based testing and systematic coverage tracking – not just increasing overall test volume.
Flaky tests ignored. Tests existed but were consistently unreliable, so the team stopped treating failures as meaningful signals. The fix is investment in test stability, not more tests.
Deadline pressure. Bugs were caught in pre-production but shipped anyway. The fix is prioritization discipline and clearer escalation paths – this is a process and culture problem, not a tooling one.
Diagnosing which of these is dominant for your team should come before any solution. The same escape rate can have very different causes.
How to reduce Escaped Defects
Continuous regression testing. Every commit triggers regression. Bugs introduced today are caught today rather than accumulating toward release.
Production-realistic test environments. Staging environments that closely mirror production catch a class of bugs that local environments will always miss.
Production monitoring as a backstop. Even mature testing processes will let some defects through. Fast detection in production limits user impact and shortens resolution time.
Root cause analyzis on every escape. Each escaped defect should generate a lightweight RCA. The findings should feed back into process, test coverage, or tooling decisions – not just fix the immediate bug.
Definition of Done standards. Teams that build quality gates into their DoD – code review standards, automated test requirements, coverage thresholds – prevent a significant proportion of defects before they enter the testing pipeline at all.
The long-term direction of travel is from defect detection toward defect prevention. Test Driven Development, CI/CD maturity, and strong Definition of Done (DoD) practices all move teams in that direction.
Escaped Defects as a software delivery quality metric
At Plandek, we measure engineering productivity across four dimensions – Focus, Speed, Predictability, and Quality. These are the Four Pillars of Software Engineering Productivity, based on research from over 2000+ organizations. The reason for that structure is exactly the tradeoff described above: push hard on Speed without watching Quality, and the system degrades. The pillars are not independent. They move together.
Escaped defects sit within the Quality pillar, which asks whether teams are delivering sustainably – or whether short-term gains are quietly creating future work.
The core Quality metrics we track alongside escaped defects are:
Bug Resolution Time – how quickly defects are addressed once found. Longer resolution times increase backlog, reduce capacity, and slow future delivery.
Stories Delivered : Bugs Raised – whether new work is introducing defects at a healthy rate. These two metrics should be analyzed as a converging or diverging pair, not in isolation.
Bugs Resolved : Bugs Raised – whether teams are keeping pace with defect load or accumulating debt. Top-performing teams resolve as many bugs as they raise, or better.
Escaped Defects add a further dimension to this picture: not just whether bugs are being created and resolved, but whether the process is catching them before they reach users. Used together, these metrics give a far more honest view of quality health than any single number – and they make the velocity/quality tradeoff visible before it becomes a customer problem.
Escaped defects also complement DORA metrics – particularly Change Failure Rate – by giving a more granular view of whether pre-production testing is working.
Track engineering productivity metrics with Plandek
Escaped defects don't happen in isolation. They're a signal from the wider delivery system, and fixing them requires visibility across the whole SDLC, not just the QA layer.
Plandek's award-winning Developer Productivity Intelligence platform sits above individual tools, combining quantitative data from your DevOps toolsets with qualitative insight from your engineers.
With Plandek, engineering leaders can:
Track software delivery metrics like escaped defects, bug resolution time, and defect ratios alongside many more actionable metrics
Identify bottlenecks and constraints across the full SDLC, not just the stage where a defect surfaced
Measure the adoption and impact of AI tools like Cursor, Copilot, and Devin – including whether accelerated output is increasing escaped defect rates downstream
Share understandable KPIs with stakeholders, connecting engineering quality to business outcomes
Plandek offers best-in-class flexibility. Metrics, dashboards, workflows, team structures, and AI reporting can all be shaped around how your organization actually operates, rather than forcing your delivery model into a rigid analytics tool.
Key Takeaways
Escaped defects are any defect found after the dev team signs off – not just bugs that reach production
Cost increases non-linearly the later a defect is found. Production escapes are the most expensive by a significant margin
Escape rates tend to rise as velocity increases. Tracking both is essential
Three root causes drive most escapes: coverage gaps, flaky tests ignored, and deadline-pressure shipping
Severity weighting and trend analyzis matter more than the headline escape rate alone
The goal is defect prevention, not just better defect detection
FAQs
What are escaped defects in software development?
Escaped defects are defects that pass through the development and testing process without being caught. The most useful definition includes any defect found after the development team has declared the work done – not just bugs that reach production.
What is a good escaped defect rate?
An escape rate below 10% is excellent; 10–20% is good; 20–40% is concerning; above 40% indicates a broken QA process. Most teams without deliberate QA investment sit in the 30–50% range.
How do you calculate escaped defect rate?
Escape rate = production defects / (production defects + pre-production defects), measured per release or per month. Weighting by severity gives a more accurate picture than the raw percentage alone.
Written by
Charlie Ponsonby
Co-founder & CEO
Charlie Ponsonby is CEO and Co-founder of Plandek, the leading Developer Productivity Insight (DPI) platform that helps software engineering teams drive productivity and transition to AI-led engineering. He writes widely on the opportunities and challenges inherent in the transition to the agentic SDLC. Prior to founding Plandek, Charlie founded Simplydigital, which grew to become the UK's largest broadband and digital services comparison business before being acquired by Europe's largest consumer electronics retailer. He started his career at Accenture and has held senior leadership roles in retail and telco. Charlie holds a degree from the University of Cambridge.


See how your engineering efforts translate into measurable business impact
Measure delivery performance, AI impact, and engineering productivity with hundreds of metrics, OOTB dashboards and custom configurations.


Contact us
UK Office
Unit 313 The Print Rooms, 164-180
Union St, London SE1 0LH
US Office
Floor 4, 1515 Mockingbird Ln,
Charlotte, NC 28209, USA