
The complete guide to Flow metrics

Flow Metrics are often discussed alongside frameworks such as DORA metrics and the SPACE framework. While there is some overlap, they answer different questions and operate at different levels of the software delivery system.
In this guide, we’ll cover
What are flow metrics?
What are the four types of flow item?
What are the five flow metrics?
How to use flow metrics?
How do systems of metrics compare?
How to use flow metrics in AI-enabled engineering?
What are flow metrics?
Flow metrics measure how work moves through a software delivery system, from the moment an idea is approved to the moment it reaches a user.
They were formalized by Dr. Mik Kersten in the Flow Framework, published in 2018, which extended Value Stream Management principles into a structured model for software organizations. The underlying concept comes from Lean manufacturing: in any system, work either flows or it waits. Flow metrics make visible which is happening and where.
The four flow item types
Before getting to the metrics themselves, it helps to understand what you're measuring. The Flow Framework categorizes every unit of work into one of four flow item types:
Features – work that creates new value for customers. The clearest line to revenue and growth.
Defects – bugs and quality issues that consume capacity without creating new value.
Risks – security, compliance, and reliability work that protects existing value.
Technical debt – architectural and maintenance work that removes drag on future delivery.
Flow metrics mean different things depending on what type of work is flowing. A high velocity of defects is not the same signal as a high velocity of features. Tracking flow items separately is what allows you to move from "we're busy" to "here's what we're actually spending our time on."
The five flow metrics explained
1. Flow Time
Flow time measures how long it takes to deliver a flow item from approval to production.
It includes everything – active work, waiting, reviews, handoffs, queues. All of it.
It’s one of two “money metrics”. Shorter flow time = faster time-to-revenue, and lower cost of delay for defect fixes.
Expert tip: When flow time is long, avoid asking whether the team is working hard enough – it’s almost always the wrong question. It’s almost always a waiting problem caused by a software engineering bottleneck, with work sitting in review queues and stalling on dependencies.
Read our Complete Guide to Identifying Software Engineering Bottlenecks
2. Flow Velocity
Flow velocity measures how many flow items are completed in a given period, regardless of size or type.
This is the second “money metric”. More features shipped typically means faster business growth. Higher defect velocity means lower support costs. The number itself matters less than the trend – is it increasing, stable, or declining, and why?
3. Flow Efficiency
Flow efficiency is the ratio of active time to total flow time, expressed as a percentage.
Flow Efficiency = (Active Time ÷ Total Flow Time) × 100
Flow efficiency is a core agile metric. Most teams, when they first measure this, find it somewhere between 15% and 40%. That means for every hour of work actually being done, two to five hours are spent waiting.
Expert tip: A high flow efficiency is not always a good thing. If work is moving at maximum speed with no slack in the system, it can indicate fragility, because there’s no buffer for quality gates or capacity to absorb unexpected problems. Healthy systems have some waiting built in.
4. Flow Load
Flow load tracks the number of items currently in progress. It is the flow metrics equivalent of Work in Progress (WIP).
High flow load is one of the most reliable predictors of poor performance across all the other metrics. When too much is in flight simultaneously, context switching increases, flow time extends, and velocity drops. The math is not complicated, but organizations consistently resist applying it because reducing WIP requires saying no to starting new work – which is politically difficult.
Expert tip: Finding the right flow load for your team requires experimentation. A useful starting point: measure current WIP and velocity together, then reduce WIP limits incrementally while watching whether velocity improves. For most teams, the optimal point is lower than their instincts suggest.
Flow load is also the most team-specific metric. What constitutes healthy WIP depends on team size, work complexity, and how interdependent the work is.
5. Flow Distribution
Flow distribution shows the proportional mix of work types – features, defects, risks, and technical debt – flowing through the system at any point in time.
This is the most strategically important flow metric and consistently the most underused.
It helps us ask: are we actually spending our time on the things we say matter?
No single distribution is inherently wrong.
Team A are skewed heavily towards features. Are they efficiently shipping value, or are they accumulating defects and technical debt?
Team B are skewed heavily towards technical debt. Have they got mature engineering discipline, or have they lost sight of customer value?
Reading the metrics as a system
The metrics are a system, and they tell a story together.
As an example, we often speak to teams experiencing common patterns, like this one:
Flow velocity declining
Flow time increasing
Flow load high
Frequently, we find teams in this situation see each individual metric as a sign of team underperformance, but the metrics taken together actually show us that too much simultaneous WIP is causing context switching. That’s slowing individual items, extending flow time and pushing velocity down.
The fix is, in this case, to reduce flow load and let items complete.
Expert tip: Start by optimizing flow time and flow load. These two metrics are the primary levers. Flow time tells you how long the system takes end-to-end; flow load tells you whether you're overloading it. Get those two stable before adding complexity with efficiency and distribution targets.
Flow metrics and the Four Pillars of Engineering Productivity
Flow metrics tell you that something is wrong. They are excellent at surfacing high-level problems.
What they are less good at is telling you where the constraint is.
Based on research across 2,000+ engineering teams, Plandek's Four Pillars of Engineering Productivity help identify the bottlenecks behind poor flow performance. Within them are the fifteen core software delivery metrics to understand how work is moving through your SDLC.
Focus: are we working on the right things?
When Flow Velocity falls, the problem is not always delivery speed. Sometimes engineering capacity is being consumed by reactive work rather than value creation.
Key metrics:
Value Delivery %
Support & Maintenance %
Common constraint: Too much engineering effort spent on bugs, incidents, support, and upkeep rather than roadmap delivery.
Speed: where is work waiting?
Flow Efficiency can tell you work is stuck. Speed metrics reveal where the queue actually exists.
Key metrics:
Lead Time to Value
Cycle Time
Time to Merge PRs
Throughput Quotient
PR Efficiency Quotient
Merge Frequency per Author
Common constraint: Delays in review, testing, integration, release, or handoffs between teams.
Predictability: can we deliver consistently?
Flow Time alone cannot tell you whether delays are predictable or chaotic. Predictability metrics expose planning and execution instability.
Key metrics:
Sprint Capacity Accuracy
Sprint Target Completion
Mid-Sprint Scope Change %
Velocity Volatility
Common constraint: Scope churn, dependency issues, unplanned work, and unreliable planning assumptions.
Quality: are we creating future drag?
Improving Flow Velocity is only valuable if quality remains stable. Otherwise today's speed becomes tomorrow's rework.
Key metrics:
Bug Resolution Time
Stories Delivered : Bugs Raised
Bugs Resolved : Bugs Raised
Common constraint: Defects, rework, and technical debt consuming future engineering capacity.
The relationship is simple: flow metrics identify the symptom; the Four Pillars help locate the bottleneck. When a flow metric turns red, the pillars tell you whether to investigate capacity allocation, delivery queues, planning stability, or quality issues.
Learn how to track the Four Pillars of Engineering Productivity out-of-the-box with Plandek
Flow metrics vs DORA metrics vs SPACE metrics vs Four Pillars
There is no single framework that explains engineering performance on its own. Flow Metrics, the Four Pillars, DORA, and SPACE all provide useful signals, but they measure different aspects of software delivery. Understanding the role of each helps engineering leaders choose the right metrics for the question they're trying to answer.
Teams practicing Agile methodologies will find that agile flow metrics can be used alongside their sprint activity metrics. Flow metrics operate at a different level to the broad groups of DevOps metrics and DevOps KPIs available.
Framework | Primary Question | Typical Audience | Example Metrics |
Flow Metrics | How efficiently does value move through the software delivery system? | Engineering leaders, CTOs, VPs Engineering | Flow Time, Flow Velocity, Flow Load, Flow Efficiency, Flow Distribution |
Four Pillars of Engineering Productivity | Where are the constraints and bottlenecks affecting delivery? | Engineering leaders and managers | Focus, Speed, Predictability, and Quality metrics |
DORA Metrics | How effectively does the software delivery pipeline perform? | Engineering and DevOps teams | Deployment Frequency, Lead Time for Changes, Change Failure Rate, MTTR |
SPACE Framework | How should developer productivity be measured holistically? | Engineering leaders and People leaders | Satisfaction, Performance, Activity, Communication & Collaboration, Efficiency |
Flow metrics operate at a higher level of abstraction: they measure how value moves through your entire engineering organization, not how fast code moves through your CI/CD pipeline.
Flow metrics in AI-enabled engineering
Most flow metrics content predates widespread AI adoption, which creates an important blind spot.
AI can dramatically increase output in parts of the software delivery lifecycle, particularly code generation and implementation. But bottlenecks do not disappear; they move.
In many organizations, AI accelerates work faster than the surrounding system can absorb it. Review queues grow, testing becomes a constraint, release processes come under pressure, and quality issues create additional rework.
The result is often more activity without a proportional increase in value delivered.
If AI is genuinely improving delivery, you should see improvements across the system. If AI is exposing existing constraints instead, a different pattern emerges:
Flow Load increases as work accumulates
Flow Time stays flat or worsens
Review and testing queues grow
Defect and rework volume increases
Velocity improvements plateau
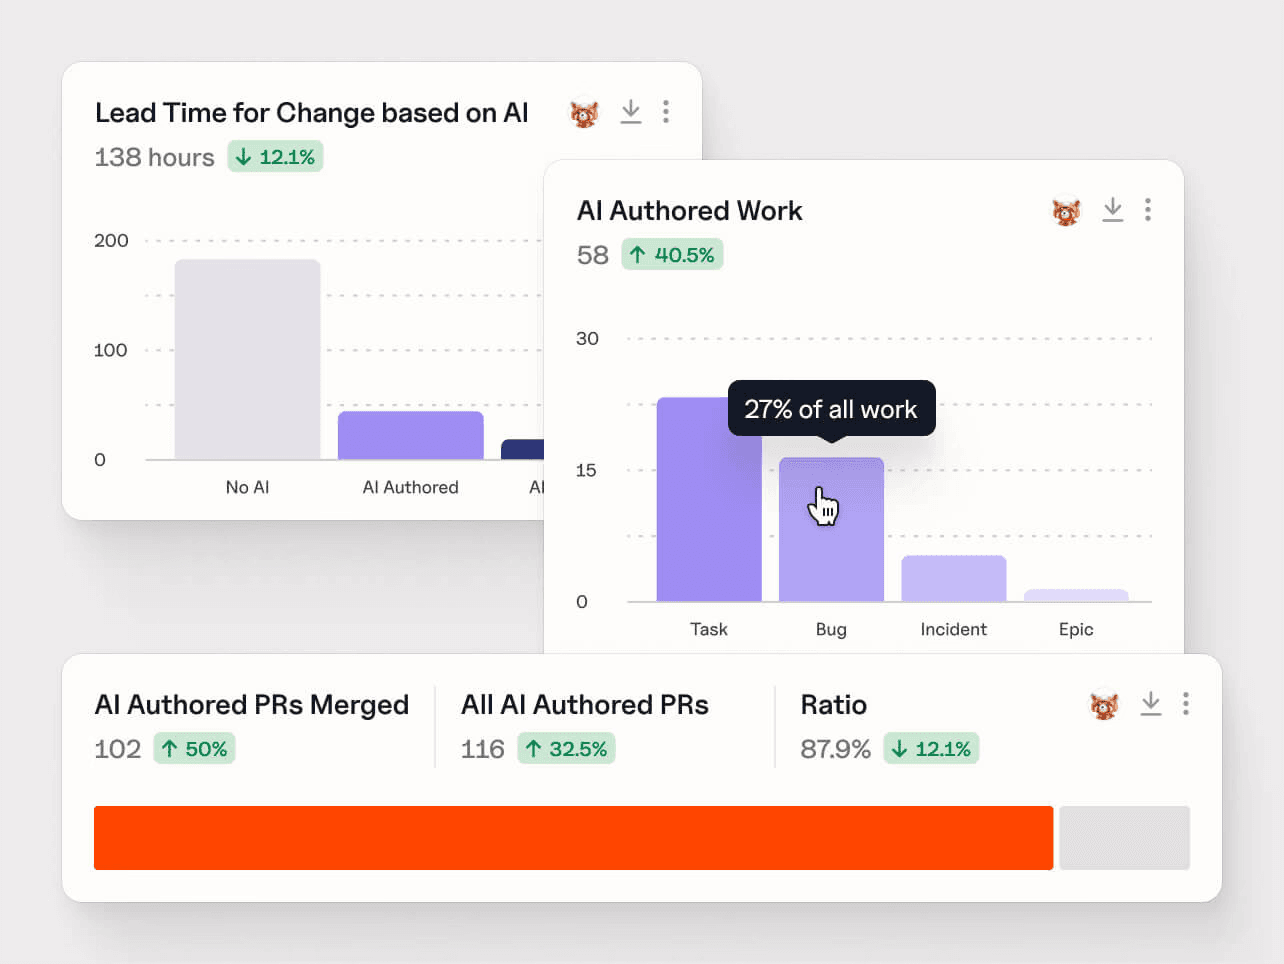
What we really need to know is whether the software delivery system is converting that additional activity into customer value. Flow metrics help answer that question by revealing where AI is improving flow — and where it is simply amplifying existing bottlenecks.
Use Four Pillars metrics to determine exactly where bottlenecks are occurring, and why.
Common mistakes to avoid
Measuring individual metrics in isolation. Flow load makes no sense without velocity. Flow time makes no sense without efficiency. Read them as a system.
Chasing all five metrics simultaneously. Pick one or two primary targets – flow time and flow load are the right starting point for most teams – and stabilize those before adding optimization targets.
Ignoring metric conflicts. Improving flow time can temporarily reduce velocity. That's not failure; it's the system adjusting. Treating every short-term regression as a problem to solve will cause you to undo genuine improvements.
Skipping flow distribution. It's the hardest conversation to have, because it makes explicit the tradeoffs between features, debt, and quality investment. That discomfort is precisely why it's valuable.
Measuring without acting. Dashboards do not improve delivery. A flow metric on a screen that doesn't change a decision is just overhead. Every metric should have an owner and a threshold that triggers an action.
Use Plandek to get a system-level view of your SDLC
Flow metrics are powerful because they reveal when work stops flowing. The challenge is figuring out where the constraint is and what to do about it.
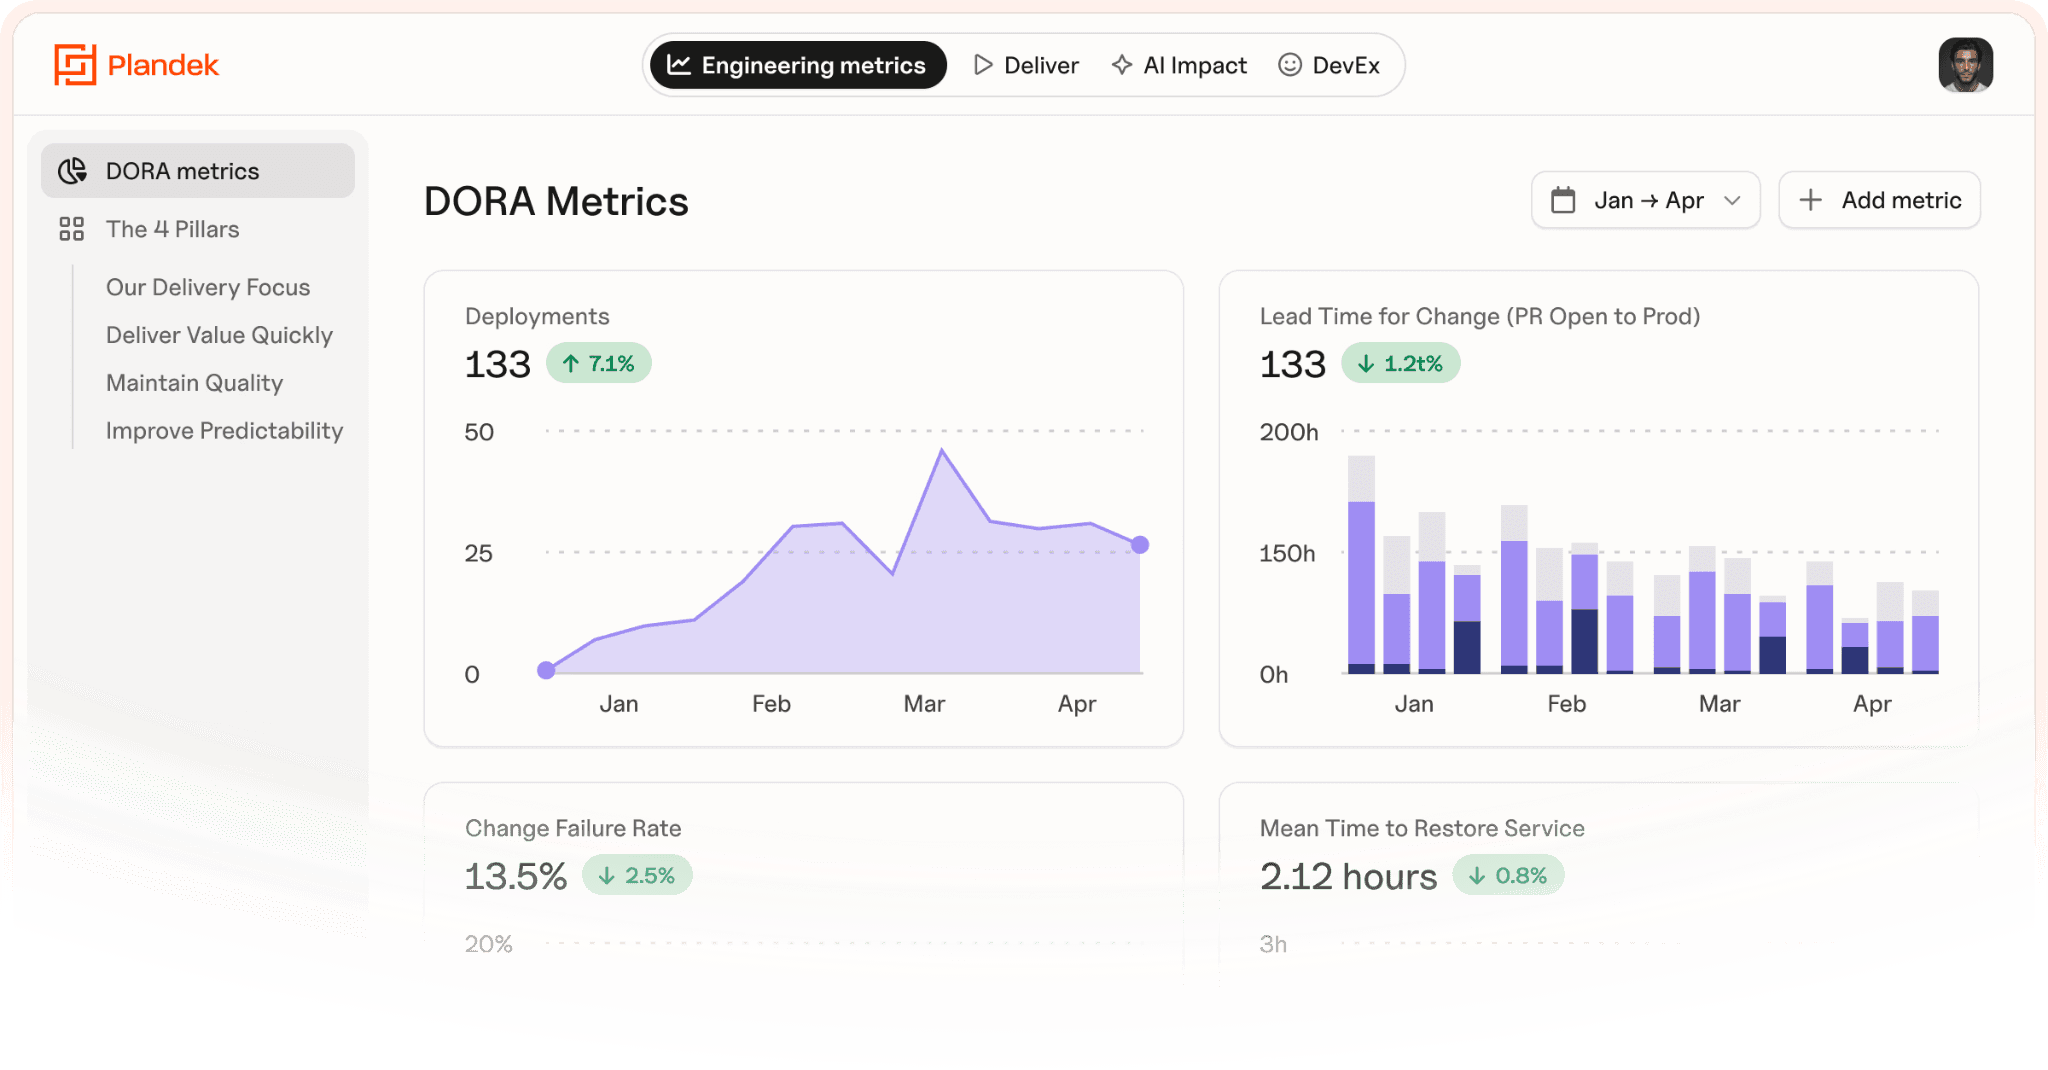
Plandek combines flow metrics, DORA metrics, AI adoption data, developer experience (DX) and software delivery intelligence in a single platform, helping engineering leaders move from symptoms to root causes faster.
Key capabilities:
Track Flow Metrics, DORA Metrics, and Engineering Productivity KPIs in one place
Identify software delivery bottlenecks and constraints across the SDLC
Connect Flow Metrics to the Four Pillars of Focus, Speed, Predictability, and Quality
Track adoption and impact of AI tools such as Copilot, Cursor, Claude, and Devin
Measure how AI affects delivery outcomes, not just developer activity
Combine engineering feedback with delivery data from Jira, Git, CI/CD, testing, and deployment systems
Share clear, business-friendly KPIs with engineering, product, and executive stakeholders
Receive AI-powered recommendations from Dekka, Plandek's AI Delivery Assistant
Flow metrics tell you that a problem exists. Plandek helps you understand why it exists, where the constraint sits, and which intervention is most likely to improve flow.
Learn how you can improve your software delivery with a free demo of Plandek
Key takeaways
Flow metrics measure how value moves through your software delivery system.
Their purpose is diagnosis, not reporting.
The real insight comes from reading all five metrics as a system.
Most delivery problems are caused by bottlenecks, queues, and waiting—not effort.
The Four Pillars help pinpoint where those constraints exist.
As AI accelerates development, flow metrics become critical for identifying the bottlenecks it exposes.
FAQs
What are flow metrics in software delivery?
Flow metrics measure how work moves through a software delivery system, from approved idea to value delivered to users. They help engineering leaders see delays, bottlenecks and capacity trade-offs.
What are the five flow metrics?
The five core flow metrics are Flow Time, Flow Velocity, Flow Efficiency, Flow Load and Flow Distribution. Together, they show how quickly work moves, how much is in progress, where it waits and what type of work consumes capacity.
How are flow metrics different from DORA metrics?
DORA metrics focus on DevOps delivery performance, such as deployment frequency and change failure rate. Flow metrics take a broader value-stream view, connecting engineering work to business outcomes.
Which flow metric should engineering leaders start with?
Most teams should start with Flow Time and Flow Load. Flow Time shows how long work takes end to end, while Flow Load shows whether too much work is in progress.
How do flow metrics help with AI-enabled engineering?
Flow metrics reveal whether AI coding tools are genuinely improving delivery or just increasing code output. If AI creates more work-in-progress, defects or downstream queues, Flow Time and Flow Distribution will expose it.


See how your engineering efforts translate into measurable business impact
Measure delivery performance, AI impact, and engineering productivity with hundreds of metrics, OOTB dashboards and custom configurations.












NEW
Contact us
UK Office
Unit 313 The Print Rooms, 164-180
Union St, London SE1 0LH
US Office
Floor 4, 1515 Mockingbird Ln,
Charlotte, NC 28209, USA