


Custom Dashboards. Re-focus on the key things that matter
As we start another New Year, many of us take the opportunity to re-focus on the key things that matter to us. Our Plandek users are no different and use our configurable Custom Dashboards to visualise the Agile delivery metrics that mean the most to their specific teams.
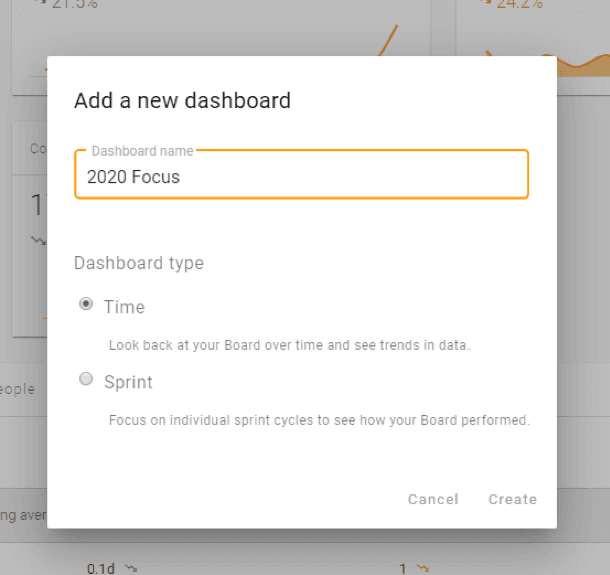
Creating a custom dashboard in Plandek
Build a completely bespoke view in just a few minutes
Within minutes, our users are able to build a completely bespoke view of metrics that measure the data points they care about, helping them drive towards clear goals and outcomes. Our clients have made use of creating different dashboard views depending on the context, leveraging differing metrics at an organisation, programme or team level.
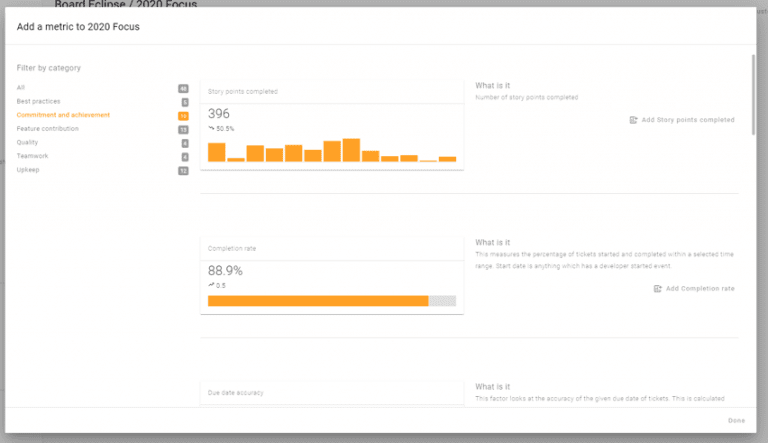
When building their custom dashboards, our users are able to easily search our library of metrics, selecting metrics based on their data, which is helpfully shown on a metrics card preview.
Some users are currently focusing on continuous improvement and use metrics like cycle time, lead time and flow efficiency to fuel that desire. Others want to reduce delivery risk and use metrics around sprint completion and quality to increase delivery predictability. When building their custom dashboards, our users are able to easily search our library of metrics, selecting metrics based on their data, which is helpfully shown on a metrics card preview.
Whatever our customer’s New Year software delivery focus, Plandek has the metrics that allow them to objectively track progress towards their goal throughout 2020.
We will be publishing a new article in the Customer Success blog post series every Friday. Stay tuned for more updates!
Visit our blog and LinkedIn page for more content from the Plandek team.
Find out more about our team.
Written by
Charlie Ponsonby
Co-founder & CEO
Charlie Ponsonby is CEO and Co-founder of Plandek, the leading Developer Productivity Insight (DPI) platform that helps software engineering teams drive productivity and transition to AI-led engineering. He writes widely on the opportunities and challenges inherent in the transition to the agentic SDLC. Prior to founding Plandek, Charlie founded Simplydigital, which grew to become the UK's largest broadband and digital services comparison business before being acquired by Europe's largest consumer electronics retailer. He started his career at Accenture and has held senior leadership roles in retail and telco. Charlie holds a degree from the University of Cambridge.


See how your engineering efforts translate into measurable business impact
Measure delivery performance, AI impact, and engineering productivity with hundreds of metrics, OOTB dashboards and custom configurations.


Contact us
UK Office
Unit 313 The Print Rooms, 164-180
Union St, London SE1 0LH
US Office
Floor 4, 1515 Mockingbird Ln,
Charlotte, NC 28209, USA