


You know what you’re spending on AI, but what are you getting back.
More usage, more tokens and faster coding do not automatically translate into more engineering value. If constraints sit elsewhere in the delivery system, the gains simply get absorbed.
That is why we’ve launched the Free AI Impact Report.
It connects AI usage and spend to engineering performance, so you can see how effectively AI is being adopted, how efficiently spend is turning into output, and what return you’re actually getting, benchmarked against more than 2,500 engineering teams.
The AI measurement problem has changed
You probably already know how much you are spending on AI. What we need is to link usage and spend to engineering performance, and ultimately, business outcomes.
Our latest Engineering Productivity Benchmarks show that among fully agentic teams in the Plandek dataset:
Cycle Time improved by 16.5%, but Lead Time to Value improved by just 3.8%
Value Delivery fell by 8.9%
Stories Delivered:Bugs Raised declined by 26.5%
In other words, AI is accelerating parts of engineering much faster than it is improving end-to-end value delivery.
If coding accelerates while requirements, review, testing or deployment remain constrained, the bottleneck moves – and faster code creation does not translate proportionately into faster value delivery.
That is the tokenomics challenge: not simply what the tokens cost, but how efficiently that spend turns into useful engineering output and business value.
Follow AI spend through to engineering output
Your AI Impact Report connects AI usage and spend to engineering performance.
Connect Git and the AI tools you already use, and Plandek analyzes 180 days of data to compare the latest 90 days with the previous 90 days. You get a one-off report, with no subscription and no new dashboard to learn.
It answers three questions:
1. Are we using AI effectively?
See daily AI usage, AI involvement in engineering work, model mix by cost, and whether your most active users are using AI enough to drive measurable impact.
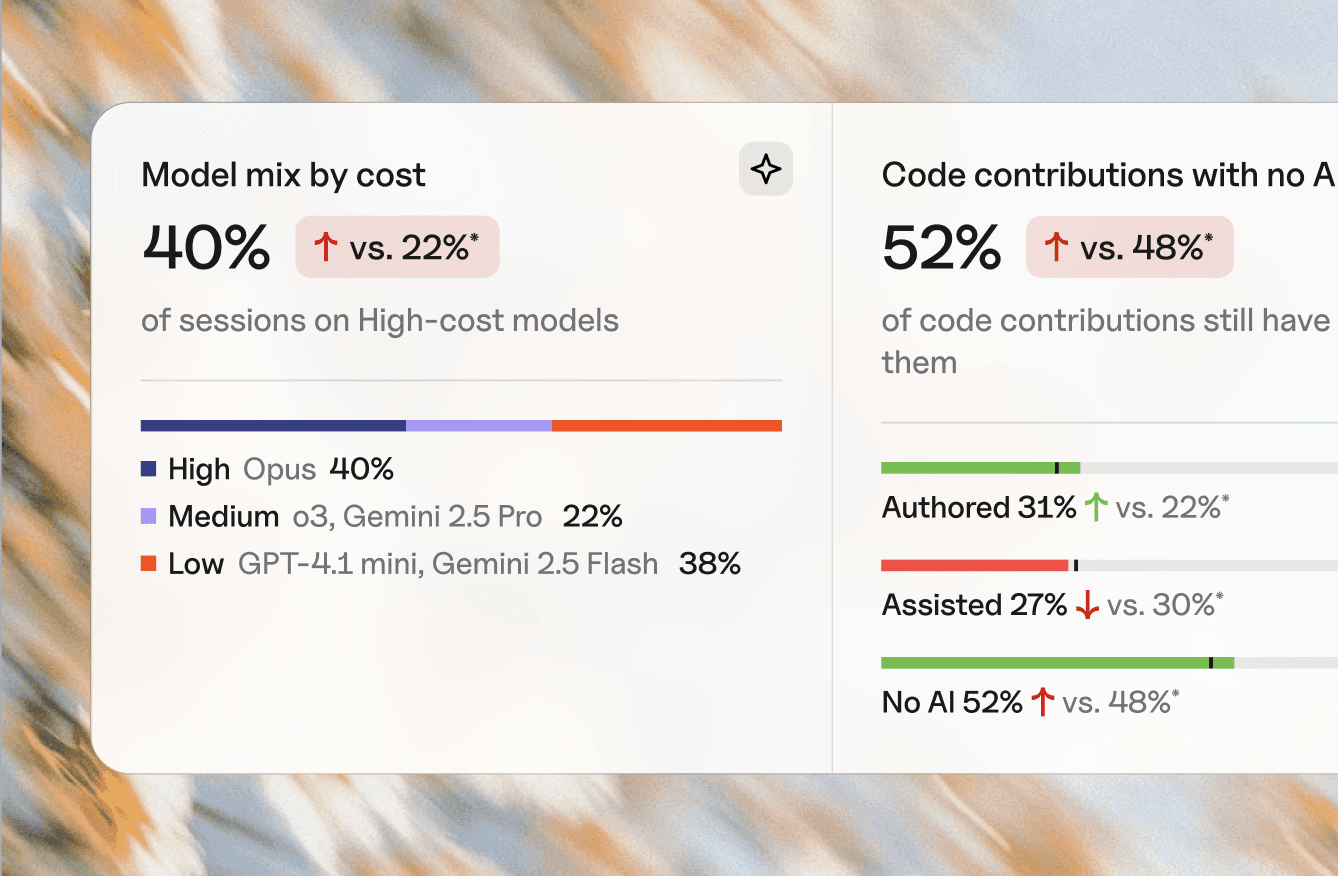
2. How efficiently is AI spend turning into output?
See how much AI-assisted work actually lands, tokens per pull request, and whether your codebases are ready for agents.

3. Are we seeing the expected return on AI?
See whether the same engineering capacity is producing more and moving faster, including the extra-engineer equivalent, speed impact and AI spend.
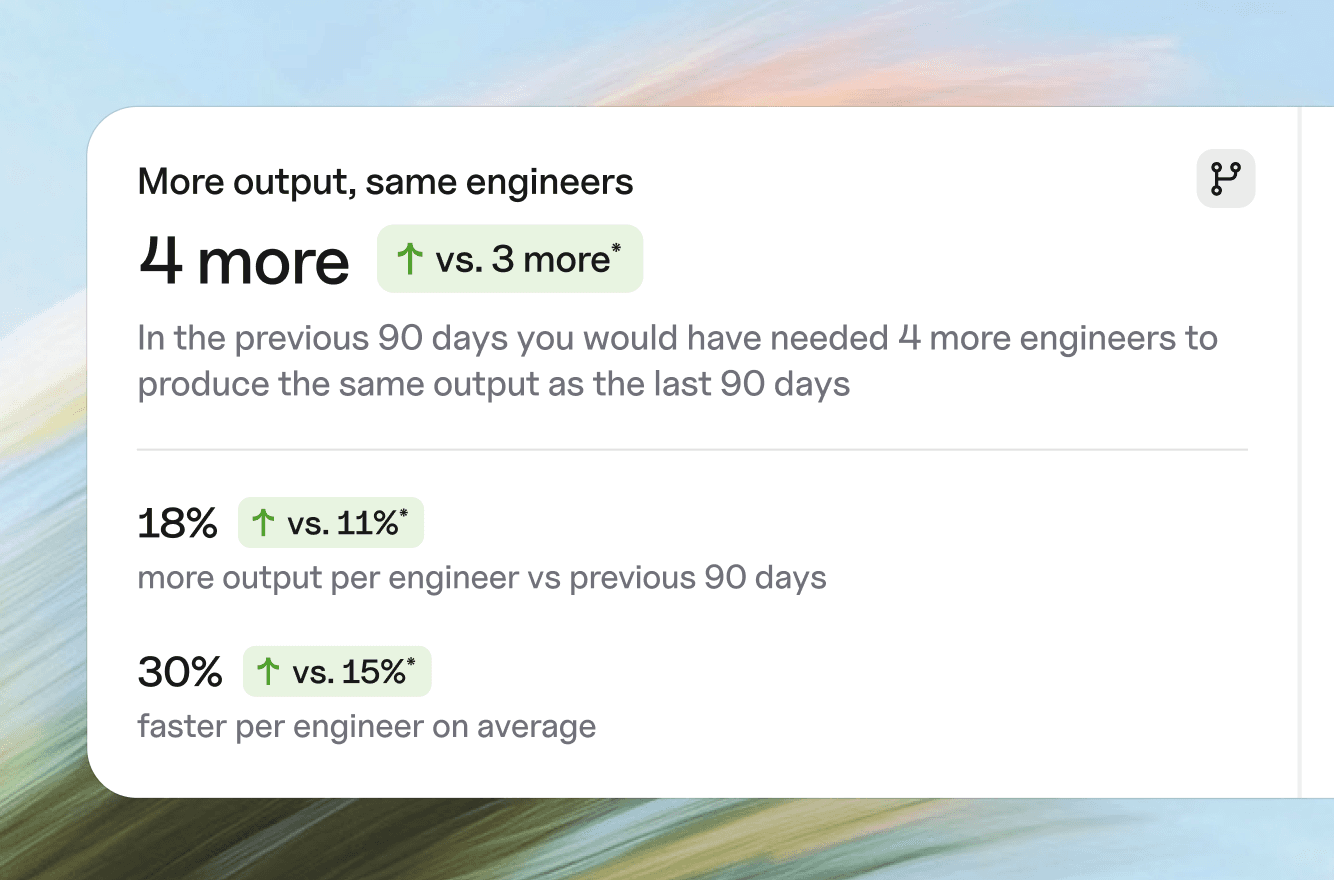
Together, those three views let you follow the chain from AI adoption to spend to engineering output to return, and ultimately see where to focus next.
Good, compared to what?
AI metrics need a reference point. Higher usage might look encouraging, while lower tokens per pull request might look efficient, but your data alone will not tell you whether your performance is actually strong.
That’s why every result in the AI Impact Report is benchmarked against more than 2,500 engineering teams.
You can see how your AI adoption, efficiency and engineering performance compare with other teams across the industry, you know exactly how you are really performing.
How it works
The process is straightforward.
1. Request your report
Ask Plandek for your free AI Impact Report.
2. Connect Git and your AI tools
Plandek supports Git plus AI tooling including GitHub Copilot, Cursor, Claude Enterprise, Devin and Codex.
3. Receive your report
We gather 180 days of data and email you a leadership-ready report covering the latest 90 days.
What about source code and security?
Plandek is built for enterprise security and data protection requirements, with encrypted data, GDPR compliance, regular independent penetration testing and security audits. Our SOC 2 Report and supporting security documentation are available on request.
You don’t need to hand over your source code to get the report. Plandek works from software delivery metadata and does not store source code or private prompts.
Read more about Plandek information security.
Ready to make every token count?

Get your Free AI Impact Report
Connect Git and the AI tools you already use and get a leadership-ready view of AI adoption, engineering output and return, benchmarked against more than 2,500 engineering teams.
Written by
Ruth Dillon-Mansfield
Growth Partner
Ruth has 10 years' experience in growth leadership in the tech industry. She has served as COO at a FTSE-listed company, and works with tech start-ups and scale-ups to help their customers understand how to realize value from their products.


See how your engineering efforts translate into measurable business impact
Measure delivery performance, AI impact, and engineering productivity with hundreds of metrics, OOTB dashboards and custom configurations.








NEW
Contact us
UK Office
Unit 313 The Print Rooms, 164-180
Union St, London SE1 0LH
US Office
Floor 4, 1515 Mockingbird Ln,
Charlotte, NC 28209, USA