
AI Productivity Metrics in Software Engineering: What Leaders Should Measure

Charlie Ponsonby

AI increases engineering activity. When AI-enabled, your teams likely generate more code, open more pull requests, and so forth – research from GitHub suggests developers can complete tasks up to 55% faster using AI tools.
But more activity does not necessarily mean better software delivery.
So, the harder question for engineering leaders is: what should we measure in order to track and verify real delivery gains?
In many organisations, lead time to production does not improve at the same rate. Teams can look more productive in isolation, while outcomes at a system level remain unchanged or become less predictable.
That is what makes AI productivity metrics difficult, and why measuring AI in software engineering requires more than tracking usage, output, or time saved.
In this blog:
How DORA and flow metrics apply, and where they fall short for AI
The metrics that matter for software development productivity
Which AI metrics mislead and why they create false confidence
How to move from AI adoption to impact using the RACER framework
DORA and Flow Metrics (And Where They Fall Short for AI Developer Productivity)
You’re probably familiar with one or both of DORA metrics and flow metrics. Engineering leaders widely use them to understand software delivery performance. They look at the system from slightly different angles, but are often used together in practice.
Area | DORA metrics | Flow metrics | Where AI creates a gap |
Primary focus | Delivery performance and stability | Movement of work through the system | AI increases activity unevenly across stages |
Key measures | Lead time, deployment frequency, change failure rate, MTTR | Cycle time, WIP, throughput, queue time | Metrics may improve locally while system constraints remain |
Strength | Strong benchmark for delivery outcomes and operational performance | Strong visibility into software engineering bottlenecks and workflow efficiency | Neither fully explains why software development performance changes under AI |
Typical insight | How fast and reliably software is delivered | Where work slows down or accumulates | Harder to see whether AI is improving flow or just increasing input |
Limitation in AI context | May not reflect early-stage bottlenecks (e.g. review, testing) until later | May show increased throughput without showing impact on quality or predictability | Neither captures how AI shifts capacity, rework, or delivery stability across the system |
These frameworks still matter, and most engineering leaders should keep using them. The issue is not with the metrics. It is with the context.
DORA and flow metrics were built to measure delivery performance in systems that are broadly behaving as expected.
AI changes that. It tends to accelerate specific parts of the SDLC first, usually code generation, without removing the constraints around review, testing, release, or planning.
That is why you can see movement in the metrics without seeing real improvement in delivery.
A System-Level View: What Is AI Productivity in Software Engineering?
If you want to understand whether AI is actually improving productivity, you have to look beyond isolated metric movement and judge whether the system itself is getting healthier.
When AI works effectively, it creates more capacity for value delivery, with better flow, without degrading execution.
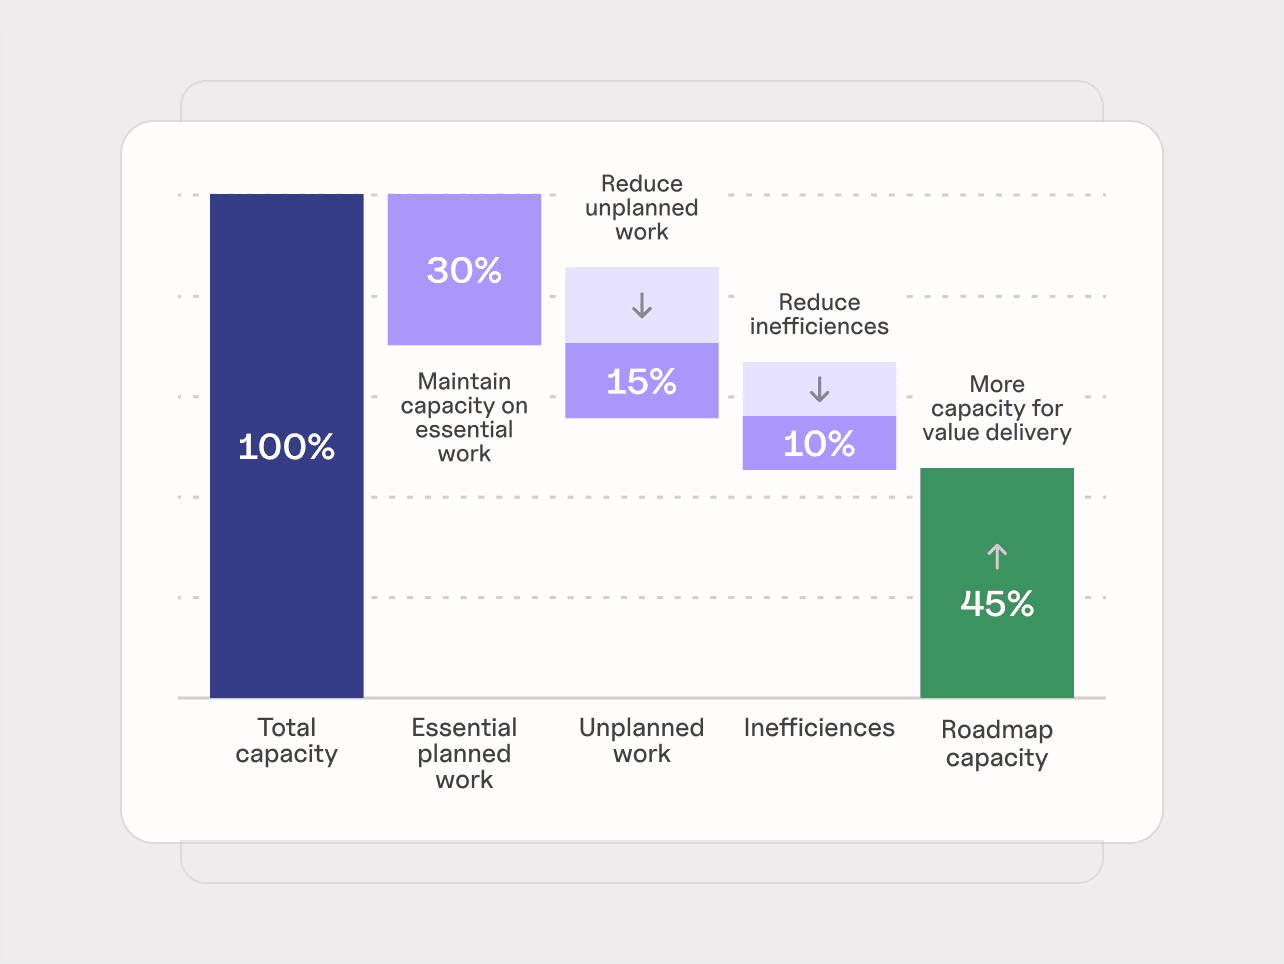
In practice, that means improving four things at once:
Focus: are teams spending more capacity on roadmap work and value delivery?
Speed: is work moving through the system more efficiently?
Predictability: are teams delivering more consistently?
Quality: is throughput increasing without creating more defects and rework?
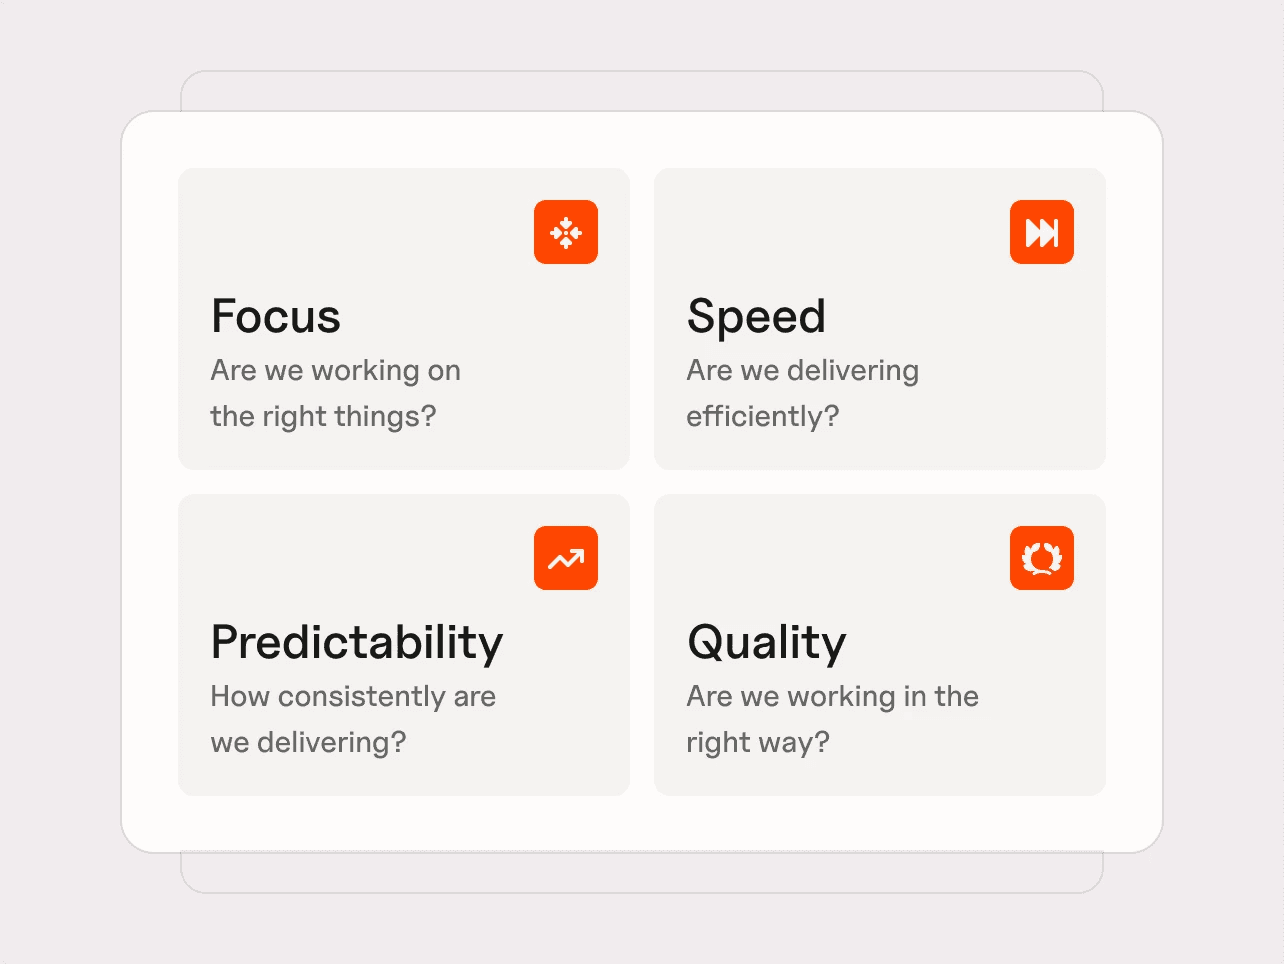
This is Plandek’s Four Pillars of Productivity.
These exist to give us a broader way to interpret our metrics – including DORA and flow metrics – particularly in AI-enabled SDLCs.
Software engineering productivity is a system outcome. It does not sit inside one tool or one stage of the workflow. It emerges from how work moves from idea to production. If any part of that system cannot absorb increased throughput, the constraint still controls delivery.
This is also why AI does not create uniform gains across teams.
Plandek’s 2026 Engineering Productivity Benchmarks showed lower-performing teams cut Lead Time to Value from 62 days to 33 days and doubled their stories-to-bugs ratio. Higher-performing teams improved too, but much more modestly, with Lead Time to Value moving from 22.5 to 20 days.
The point is not whether a team is “low” or “high” performing. The point is how constrained the system already is. Where review, testing, planning, or release are creating drag, AI can remove a meaningful amount of friction. Where delivery is already efficient, the gains are more incremental.
The Four Pillars of Productivity: AI productivity metrics engineering leaders should track
Once productivity is defined at a system level, there are really two things to understand:
whether AI is being used at all
whether it is improving delivery
The Four Pillars of Productivity Framework defines what better delivery looks like (focus, speed, predictability, and quality), and groups metrics into four corresponding groups:
Focus – are we working on the right things?
How much engineering capacity is directed toward value delivery, rather than being consumed by support, rework, or maintenance?
Value Delivery %
Support and Maintenance %
Speed – are we delivering efficiently?
How quickly does work move from idea to production, and how efficiently teams convert effort into delivered output?
Lead Time to Value
Cycle Time
Throughput Quotient
Time to Merge PRs
PR Efficiency Quotient
Merge Frequency per author (per week)
Predictability – how consistently are we delivering?
How reliably can teams plan and execute work, without excessive volatility or disruption?
Sprint Capacity Accuracy
Sprint Target Completion
Mid-Sprint Scope Change
Velocity Volatility
Quality – are we delivering sustainably?
Is increased throughput creating lasting value, or generating defects and rework that consume future capacity?
Bug Resolution Time
Stories Delivered : Bugs Raised ratio
Bugs Resolved : Bugs Raised ratio
Use these metrics for a system-level view of engineering productivity, to show not just how much work is being done, but how effectively that work turns into delivered value.
AI metrics that often mislead engineering leaders
The easiest AI metrics to collect are often the least useful.
Most of them sit too close to the point of code generation. They tell you that AI is being used, or that activity is increasing. They do not tell you whether the system is delivering better outcomes.
That is why these metrics need to be treated carefully:
AI-generated code percentage – shows usage, not whether that code improved delivery
PR volume and commit volume – can rise while review slows, quality drops, or lead time stays flat
Self-reported time saved – useful as a supporting signal, but too subjective to treat as proof of productivity
Tool usage alone – adoption matters, but adoption is not impact
Even established frameworks can be misread in the same way. DORA metrics, for example, may show stable deployment performance while earlier stages such as review or testing are quietly becoming more constrained under higher AI-driven throughput.
The issue is rarely the metric itself. It is whether you are asking it to answer a question it cannot answer.
If the question is whether AI is improving engineering productivity, metrics that only capture activity, usage, or local speed will not get you there.
How to move from AI adoption to real impact: the RACER framework
Metrics tell you what is happening in your system. They do not tell you where you are in the journey from AI adoption to real impact – measurable improvements in delivery.
This is where a simple adoption and progression model becomes useful.
We use the RACER framework to structure that journey:
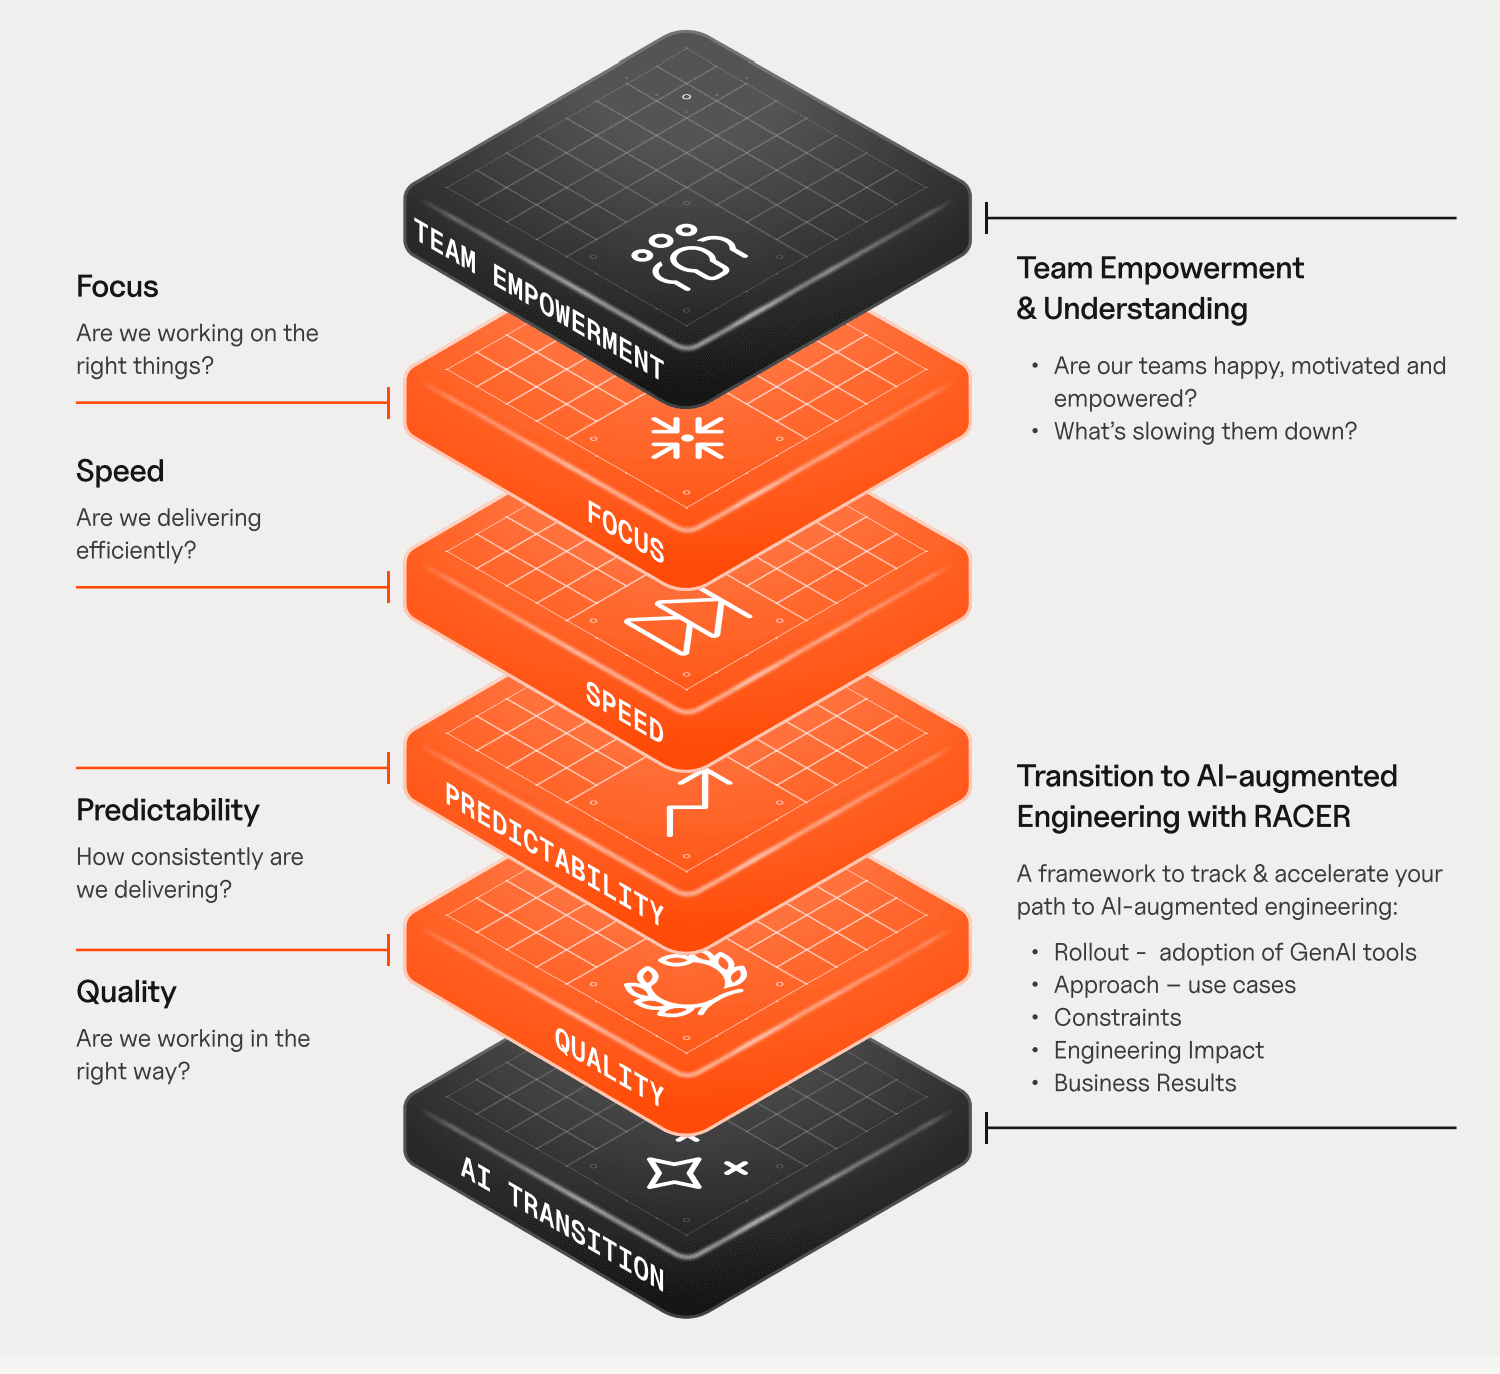
Rollout – are AI tools being adopted across teams and workflows?
Approach – are they being applied to the right parts of the SDLC?
Constraints – where is increased throughput meeting system bottlenecks?
Engineering Impact – is AI improving focus, speed, predictability, and quality?
Results – are those improvements translating into increased value delivery?
In practice, most teams move quickly through rollout, but slow down when impact depends on the surrounding system.
RACER helps make that progression visible. It connects AI adoption to how work behaves across the SDLC, and whether that ultimately leads to better delivery outcomes.
Used alongside the Four Pillars, it provides a practical way to understand not just whether AI is being used, but whether it is improving how the system performs.
→ Struggling with AI in your SDLC? Understand the RACER Framework
Where Plandek fits: connecting AI activity to real delivery outcomes
Plandek’s best-in-class software brings together data from across your SDLC – planning, development, review, testing, and release – so you can see how work actually flows, where it slows down, and how AI is affecting that flow.
Plandek gives you that visibility you need to understand where and how AI impacts your SDLC, and ultimately, value delivery.
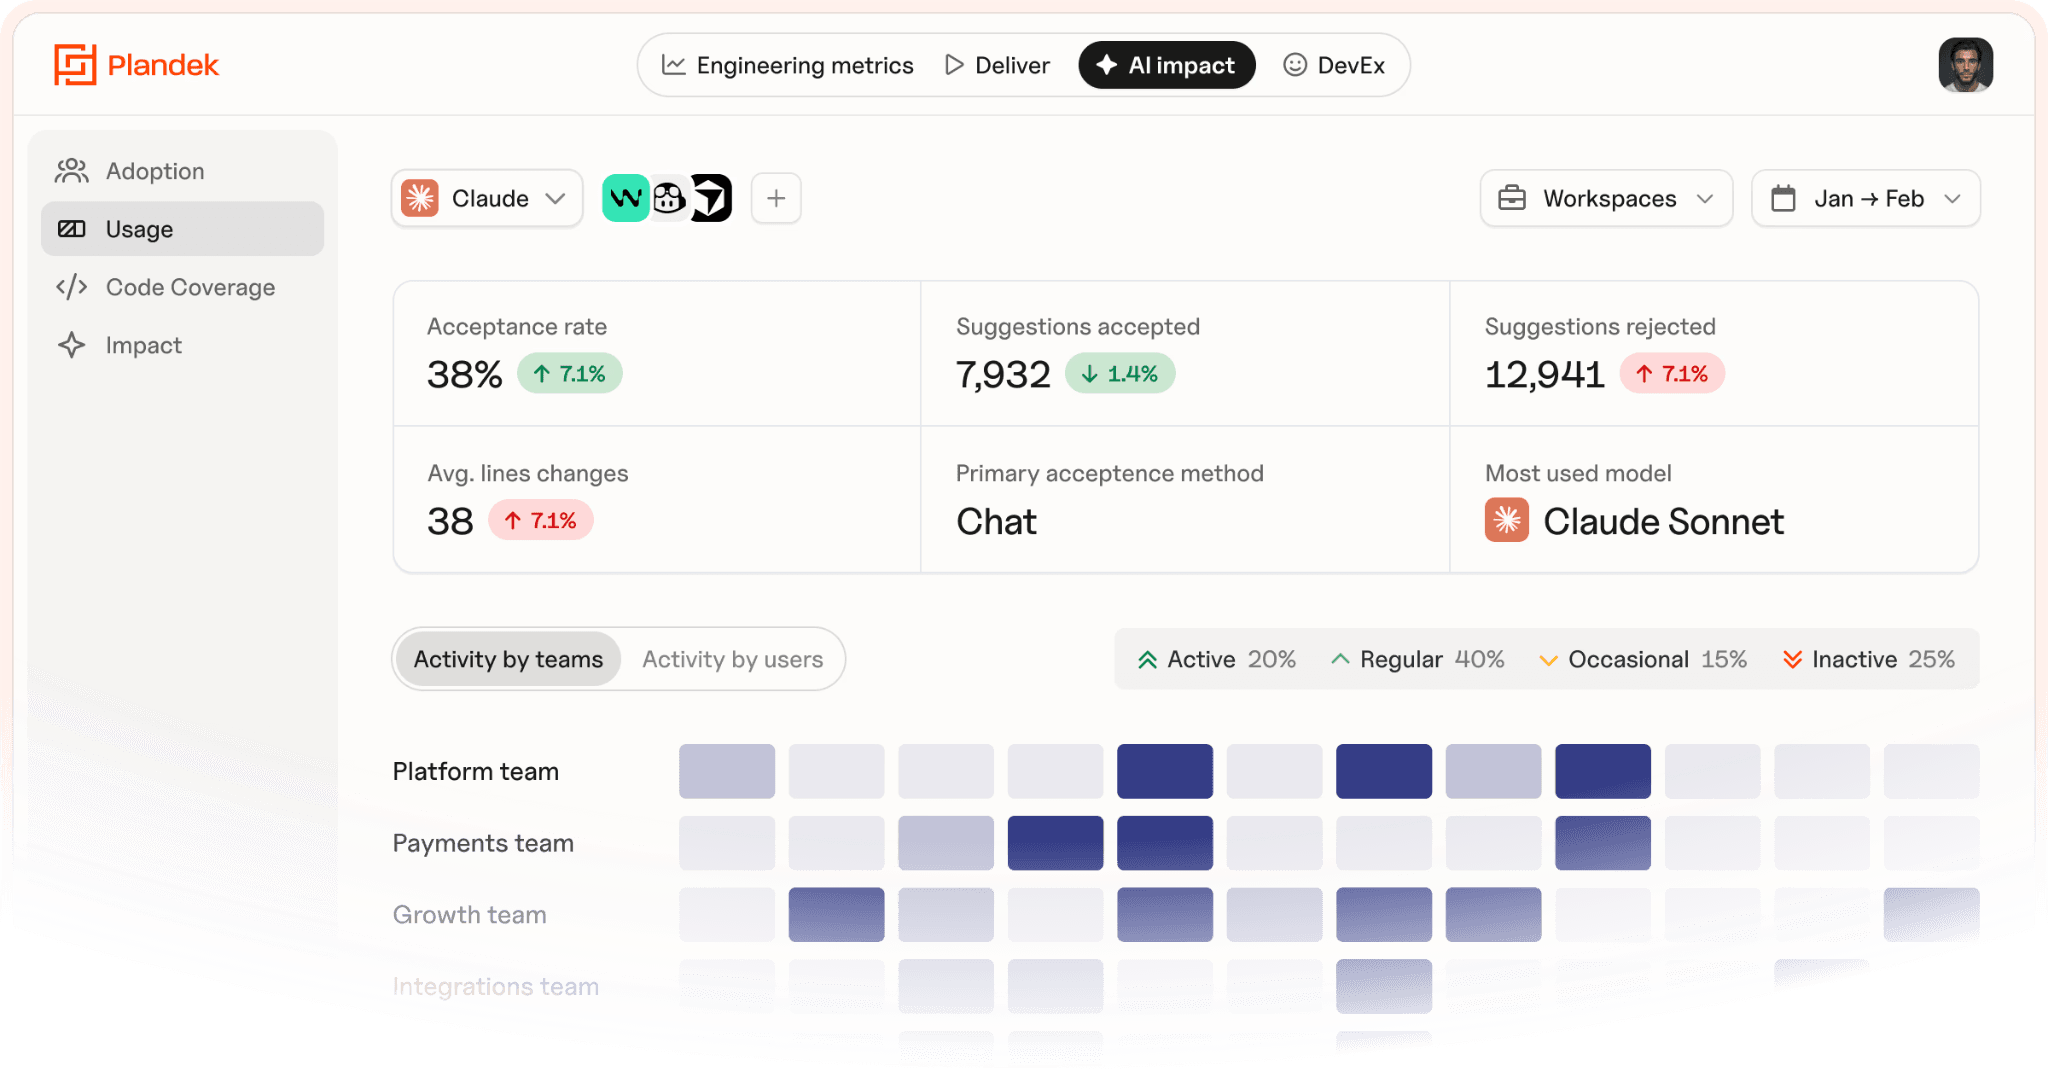
In practice, that means you can:
see whether faster coding is improving Lead Time to Value, or just increasing review pressure
understand how AI is affecting predictability, not just output
track whether quality holds as throughput increases
measure whether more capacity is actually shifting toward value delivery
👉 See how Plandek helps engineering leaders measure, manage, and scale AI impact across the SDLC
Key takeaways
AI increases activity, not necessarily delivery – more code and PRs don’t guarantee faster or better outcomes
Productivity is a system outcome – it depends on how work flows from idea to production, not just coding speed
DORA and flow metrics still matter – but they don’t fully explain AI’s impact without broader context
The Four Pillars define real productivity – focus, speed, predictability, and quality must improve together
Most AI metrics are misleading in isolation – usage and output metrics rarely reflect delivery performance
AI impact depends on system constraints – without addressing bottlenecks, increased activity won’t translate into value
FAQs
What are AI productivity metrics in software engineering?
AI productivity metrics measure whether AI tools improve software delivery, focusing on system outcomes like speed, quality, predictability, and value delivery, not just activity.
How do you measure AI productivity in engineering teams?
Measure AI productivity by tracking changes across the SDLC, including lead time, quality, predictability, and capacity spent on value delivery, alongside adoption.
Why doesn’t higher AI usage always improve delivery?
Because AI often speeds up coding without fixing bottlenecks in review, testing, or release, leading to more work entering the system without improving output.
Are DORA metrics enough to measure AI impact?
DORA metrics are essential but incomplete for AI. They show delivery performance but don’t fully explain how AI affects flow, constraints, or system behaviour.
What are the most important metrics for AI in software engineering?
The most important metrics align to focus, speed, predictability, and quality – such as Lead Time to Value, Cycle Time, defect ratios, and Value Delivery %.
How does AI affect software engineering bottlenecks?
AI typically increases throughput at the coding stage first, which can expose or worsen bottlenecks in review, testing, and release if those constraints are not addressed
Written by
Charlie Ponsonby
Co-founder & CEO
Charlie Ponsonby is CEO and Co-founder of Plandek, the leading Developer Productivity Insight (DPI) platform that helps software engineering teams drive productivity and transition to AI-led engineering. He writes widely on the opportunities and challenges inherent in the transition to the agentic SDLC. Prior to founding Plandek, Charlie founded Simplydigital, which grew to become the UK's largest broadband and digital services comparison business before being acquired by Europe's largest consumer electronics retailer. He started his career at Accenture and has held senior leadership roles in retail and telco. Charlie holds a degree from the University of Cambridge.


See how your engineering efforts translate into measurable business impact
Measure delivery performance, AI impact, and engineering productivity with hundreds of metrics, OOTB dashboards and custom configurations.


Contact us
UK Office
Unit 313 The Print Rooms, 164-180
Union St, London SE1 0LH
US Office
Floor 4, 1515 Mockingbird Ln,
Charlotte, NC 28209, USA