


Using end-to-end metrics to understand and mitigate software delivery (capability) risk
Introduction
Governance and risk management is an increasingly active research area in Agile software delivery – particularly in large-scale organisations. Moving to an effective Agile methodology is a major strategic decision. It takes a lot of time and effort, and questions are inevitably asked (from the C-suite down) about its effectiveness and reliability for critical software delivery initiatives.
Moreover, by its very nature, Agile involves decentralising responsibility to small self-determining teams working in a more organic (agile) way than would be the case in a more traditional waterfall environment. This decentralised model (which is quite rightly at the heart of the Agile philosophy) can make understanding software delivery risk difficult without effective metrics in place.
As a result, we often hear of the exasperation with existing RAG (Red, Amber, Green) progress reports – with workstreams classified as “Green” for weeks in a row before flipping to “Red” with apparently no warning!
This short post discusses the analytics and metrics that can be applied to try and ensure that such surprises do not happen, as delivery managers have a much better understanding of the underlying risks within their software delivery teams (capability).
Delivery Capability Risk
For the purposes of this discussion, we are defining “delivery risk” as the risk of delivering software increments:
later than expected; and/or
of worse quality than expected and/or
requiring more effort/resources than anticipated.
Understanding software delivery risk in totality is a complex task, with various internal and external factors driving delivery risk. This paper is interested in a key internal risk that is directly controllable by the delivery team, which we term Delivery Capability Risk (DCR).
The concept of DCR is summarised in the graphic below. A great range of Enterprise Agile Planning solutions help you manage your delivery journeys (programmes). They track scope, effort and apparent progress. They cannot really understand how effectively the teams writing and releasing the software are working together.
DRC analysis lifts the bonnet (hood) on your delivery capability to understand the real risks across the teams responsible for design, development, testing, builds and deployment.
In our view, only when you fully understand these delivery capability risks can you have a real understanding of broader delivery risks.
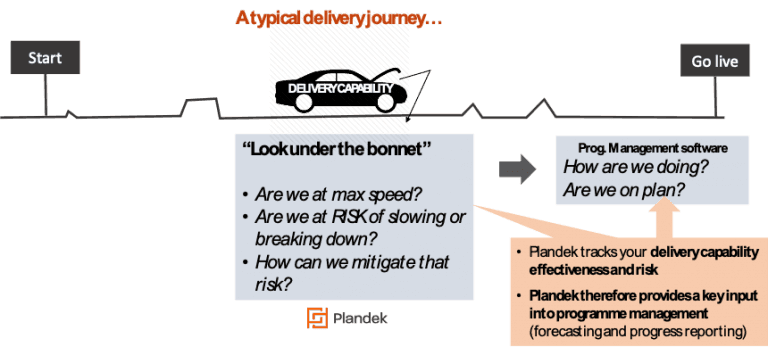
Figure 1. Graphic showing the concept of Delivery Capability risk assessment
Understanding Delivery Capability Risk in complex IT programme management
There is a set of metrics that can quite accurately track delivery capability risk (DCR), but they are tricky to surface without specialist BI solutions like Plandek.
Plandek, for example, works by mining data from toolsets used by delivery teams (such as Jira, Git, CI/CD tools and Slack) to surface the metrics critical to identifying and managing DCR.
It creates a balanced set of metrics that determine delivery capability risk, using both quant data from the underlying tools sets such as Jira, Git, etc – and also from the engineers themselves via constant polling through Slack or other collaboration hubs.
The metrics fall into five logical categories, which, when synthesised together, give an accurate measure of DCR when tracked over time. These categories are:
Backlog health analysis – metrics and analytics to understand as far as possible the state of the team’s backlog, especially as it relates to the current and next programme cycle;
Talent – quant metrics to understand your delivery teams’ morale and views on process effectiveness (collected via polling on collaboration hubs);
Process efficiency and transparency – metrics that reveal the effectiveness of the end-to-end delivery process (e.g. Flow Efficiency and Lead Time analysis), which reveal bottlenecks and friction in the process;
Throughput and time to value – metrics showing the volume of work being produced and time taken to deliver across the end-to-end SDLC;
Delivery (sprint) accuracy – metrics showing teams’ ability to meet their own sprint goals (for Scrum Agile), which is a key determinant of the likelihood of delivering over longer time periods (e.g. Programme Increments).
Examples of these metrics are shown in Figure 2 below.
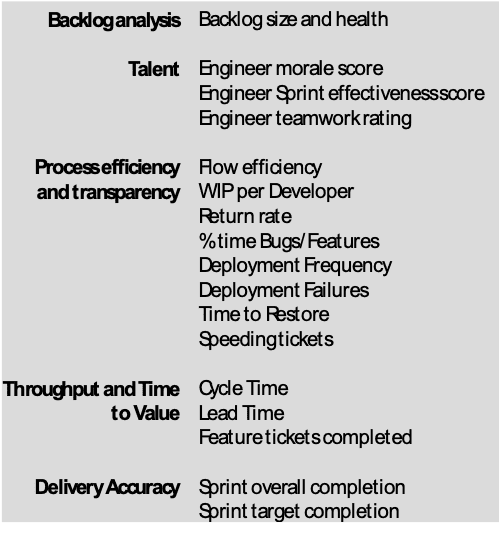
Figure 2. An example of end-to-end software delivery metrics that determine delivery (capability) risk
This balanced scorecard of capability risk metrics adds a new dimension to overall programme risk management.
As Figure 2 shows, these metrics are principally designed for use in an Agile delivery context (with concepts of Cycle Times, Sprint Completion, etc). Still, many can also be applied in a hybrid “Scrumfall” context (often adopted by larger organisations to deliver major projects).
For example:
Metrics relating to backlog health are clearly key in any context (and reveal hidden risks);
real-time understanding of engineer morale and engineer feedback, as regards the delivery process, are also critical leading indicators of (hidden) delivery risk, and so too are;
changes in time spent (and the efficiency of) fixing bugs and technical debt.
These are all “under the bonnet” metrics that, when viewed together, give the experienced Delivery Manager a view on the health of the delivery “engine” – is it firing on all cylinders or running on empty…?
Applying delivery capability risk to overall project risk management frameworks
Programme management techniques typically map the various workstreams and understand interdependencies and the critical path.
These techniques create well-organised Gantt charts showing the theoretical progress of the project relative to planned milestones. However, these techniques cannot effectively track the health of the underlying technology delivery capability.
i.e. the Gantt chart may show that we just hit a key milestone, but understanding the health/stress of the underlying delivery team may paint a very different picture. It may show that this was achieved in an unsustainable way (low morale, declining process efficiency, increasing technical debt, etc) – hence, the team is unlikely to hit the next milestone.
This is why understanding delivery capability risk (i.e., understanding the health of the underlying delivery “engine”) can be a vital extra dimension in complex IT programme management.
This is indeed why Plandek is used as a delivery risk management tool to be applied in conjunction with existing Enterprise Agile Planning tools (such as Jira, Jira Align, Rally, etc).
Written by
Charlie Ponsonby
Co-founder & CEO
Charlie Ponsonby is CEO and Co-founder of Plandek, the leading Developer Productivity Insight (DPI) platform that helps software engineering teams drive productivity and transition to AI-led engineering. He writes widely on the opportunities and challenges inherent in the transition to the agentic SDLC. Prior to founding Plandek, Charlie founded Simplydigital, which grew to become the UK's largest broadband and digital services comparison business before being acquired by Europe's largest consumer electronics retailer. He started his career at Accenture and has held senior leadership roles in retail and telco. Charlie holds a degree from the University of Cambridge.


See how your engineering efforts translate into measurable business impact
Measure delivery performance, AI impact, and engineering productivity with hundreds of metrics, OOTB dashboards and custom configurations.


Contact us
UK Office
Unit 313 The Print Rooms, 164-180
Union St, London SE1 0LH
US Office
Floor 4, 1515 Mockingbird Ln,
Charlotte, NC 28209, USA