
Key Kanban Metrics: what are they and how to measure them effectively

Charlie Ponsonby

While Scrum focuses heavily on Sprint and iteration metrics, Kanban is all about a smooth, steady flow of value. Done well, Kanban should result in reduced waste, fewer bottlenecks, faster delivery, and increased productivity.
With these potential successful outcomes in mind, we have identified some of our most popular metrics for Kanban Teams at Plandek. Together, they will track and measure your team's efficiency and progress and help you identify areas of optimisation.
These metrics are all included in the Plandek dashboard template 'Kanban Metrics - Starter Deck' - add it to your workspace via 'Manage Dashboards' -> 'Plandek Templates' to get set up guidance.
9 Key Kanban Metrics
Lead Time and Cycle Time
Code Cycle Time
Throughput
Created VS Completed Tickets
Backlog Health
Max WIP
Flow Efficiency
Frequency of Deployments
Bonus Metric: Ticket Flow
1. Lead Time and Cycle Time
Both Lead Time and Cycle Time are essential Kanban metrics. While Lead Time measures how long a Ticket takes from creation to completion, Cycle Time measures the time from when your team starts actively working on the Ticket until it is completed.
To learn more about Lead Time, read this: Delivery Lead Time
Why should you implement Lead Time and Cycle Time?
Tracking your Lead Time/Cycle Time averages will help you with the following:
Accurately identify how quickly you can deliver value to your end user
Detect and analyse bottlenecks in your delivery stages
Identify trends or pain points in your delivery process
What data do you need to add these metrics?
Ticket data (mandatory)
Deployment data (optional)
How to set up Lead Time or Cycle Time on Plandek
Select the ‘Delivery Time' metric (see the guide to read more on how to configure this metric). For Lead Time, you should include all statuses in the Calculation. Cycle Time should exclude any of the statuses a Ticket goes through prior to development starting. Don't forget to exclude any Tickets that have been resolved with a resolution state that indicates it was not actually done (e.g. won't do).
You can overlay these two together to get one combined view and understand the correlation between the two times:
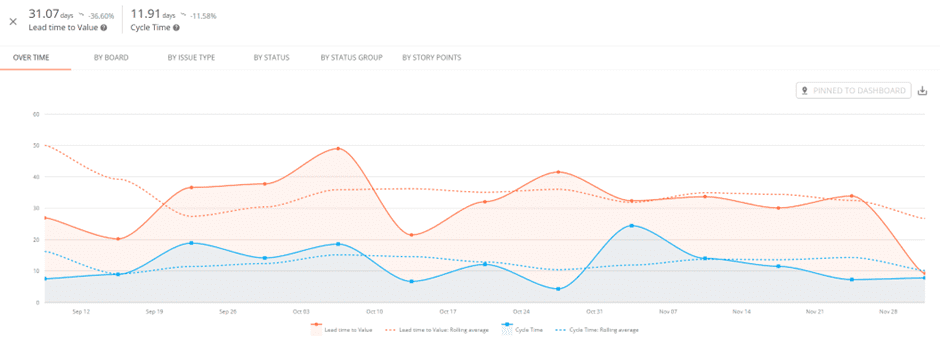
Lead Time to Value vs. Cycle Time | Plandek Dashboard
You can also add useful breakdowns. This example below is the 'By Status Group' breakdown, which can help areas in the SDLC which are the most time-consuming and could be focal improvement points. At a glance, it is clear to the viewer that the biggest potential area for improvement is the time spent in 'Ready for Dev'.
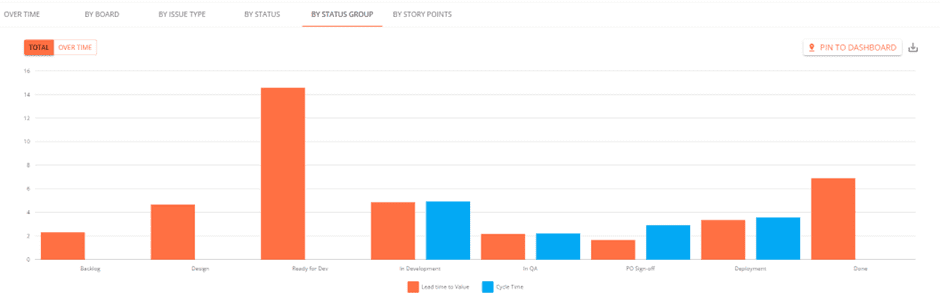
Lead Time and Cycle Time Breakdown | Plandek Dashboard
2. Code Cycle Time
Empirical data shows that Code Cycle Time typically accounts for 20-30% of Cycle Time. The PR process is often a key source of ‘hidden' inefficiencies in the ways teams collaborate. Kanban teams should keep visibility of this. Tracking the efficiency of the Pull Request process, it analyses all completed pull requests within the specified time range and illustrates the average time to complete them.
To learn more about Code Cycle Time, read this: Code Cycle Time
Why should you implement Code Cycle Time?
Code Cycle Time can help you identify areas or teams where improvements may be made. Examples of this include:
Viewing the metric with a stage breakdown quickly helps you identify the most time-consuming stage
Breaking down the data by repository, highlighting for you which repositories may impact your Lead Time to deliver the most
Breaking down by Author to see which developers may be struggling to get the support they need
Adding a stage filter with a breakdown by author and identifying that one author's approval requests are taking longer to be reviewed than the average, indicating they may need support to help with engagement
What data do you need to add to this metric?
Code repository data (mandatory)
Deployment data (optional)
How to set up Code Cycle Time on Plandek
Select the ‘Code Cycle Time' metric (see the guide to read more on how to configure this metric), and add a breakdown by stage. If you have added the pipeline deployment metric, you may prefer to limit the metric to include only Tickets which have been part of a production deployment. To do this, simply select the check box in the 'Deployment data' section.
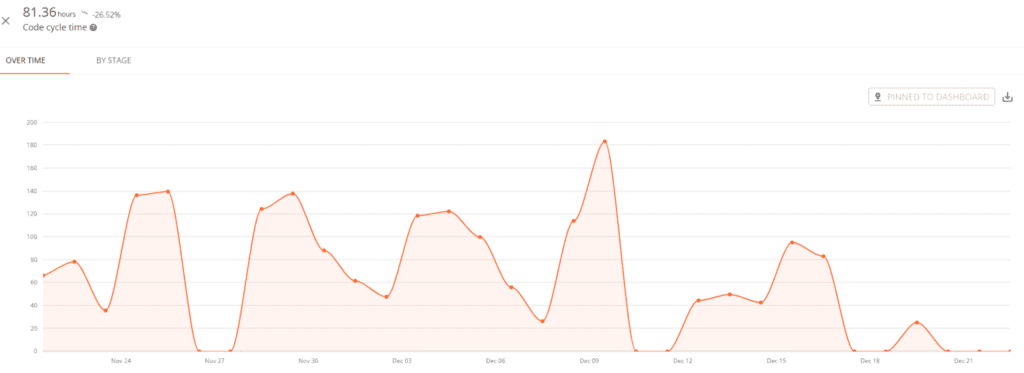
Code Cycle Time | Plandek Dashboard
3. Throughput
Quite simply, Throughput measures the number of Tickets delivered to completion in a specific timeframe. The trend over time is more important than the actual Throughput and how this reflects potential challenges teams experience.
Why should you implement Throughput?
Tracking your Throughput will help you in the following ways:
It provides an indication of your team's current productivity, as well as informative trends over time
Knowing your average Throughput can help predict your future output
Deviation from the median Throughput rate can help identify when issues occur
What data do you need to add to this metric?
Ticket data (mandatory)
How to set up Throughput on Plandek
Select the ‘Completed Tickets' metric (see guide). Apply a filter of Resolution type, excluding uncompleted statuses, i.e. ‘Won't Do', and add a breakdown, e.g. Issue Type. After saving, open the breakdown tab and select the ‘OVER TIME: STACKED CHART' option.
Depending on your dashboard's ‘Date and Granularity' frequency and date range settings, it will provide a view of how many Tickets were completed in each day/week/month.
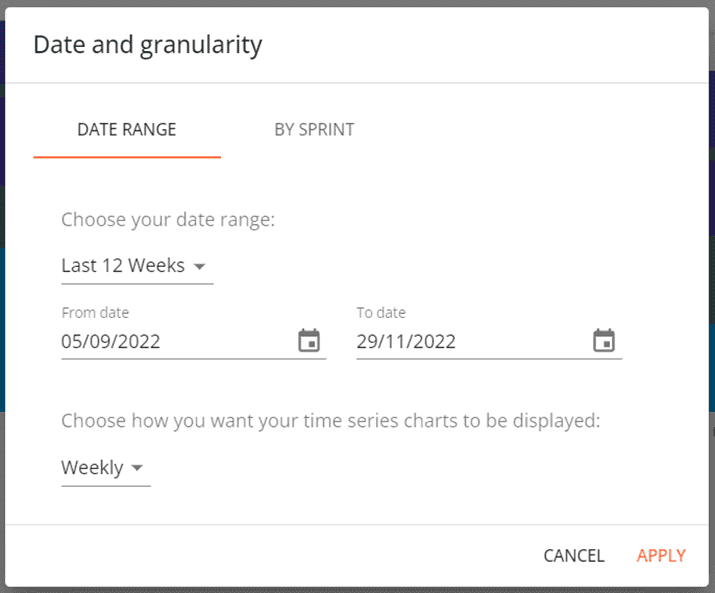
Date and Granularity Filter | Plandek Dashboard Configurator
You can easily identify Throughput trends over time. In this example, you can quickly see the 12-week Throughput was 234, just 5.26% down from the previous 12 weeks, but the weekly Throughput was down in late September/Early October, which should be investigated:
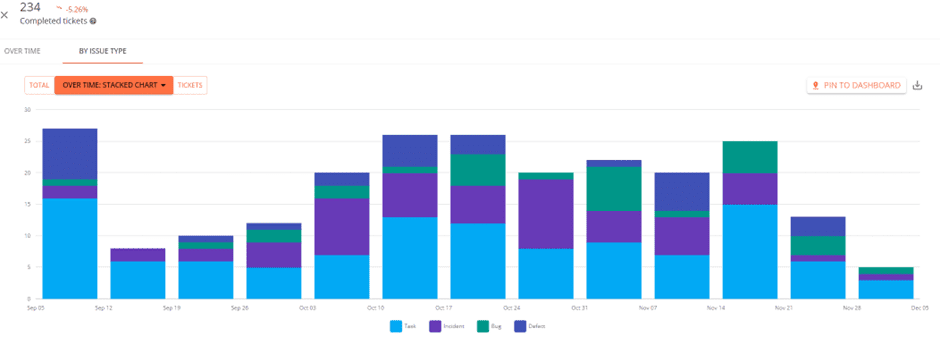
Completed Tickets are broken down by Issue Type | Plandek Dashboard
4. Created VS Completed Tickets
This is a very simple but very effective metric that highlights the input vs the output of your team.
Why should you implement Created vs Completed Tickets?
Very quickly, viewers can see:
Indications of a growing or shrinking backlog
The maturity and ability of your team to meet demand and capacity
Drilling down into specific issue types enables the identification of specific issues, such as bugs.
What data do you need to add to this metric?
Ticket data (mandatory)
How to set up Created VS Completed Tickets on Plandek
Simply select the ‘Created Tickets' metric (see guide). Now add an overlay of the ‘Completed Tickets' metric (see guide). Again, don't forget to exclude Tickets that aren't resolved through the Resolution filter. You can add breakdowns and filters (note that if you add filters, make sure that you apply the same filters to both metrics for an accurate comparison).
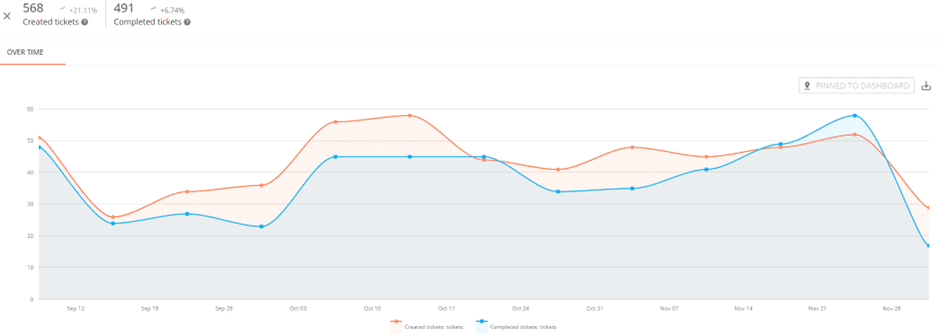
Created Tickets VS Completed Tickets | Plandek Dashboard
5. Backlog Health
This metric identifies the size, components, and trends of the product backlog. Kanban teams must be familiar with their backlog to plan future work and resources confidently.
Why should you implement Backlog Health?
There are many use cases for this metric, but here are several examples:
The number of Tickets in the backlog is decreasing over time, indicating that the team may not have enough work in the future, so you may need to talk to the product owner.
Conversely, the number of Tickets in the backlog is continually increasing over time, indicating that you may need to increase capacity. Otherwise, your Lead Time will increase, or some Tickets may keep being deprioritised in favour of more urgent work.
The portion of Tech Debt Tickets is growing weekly in the backlog, illustrating that it may be necessary to either increase the weekly Tech Debt work or to timebox a week for the team to clear Tech Debt before issues arise in production.
Most of the dev Tickets currently in your backlog are flagged as Java Tickets, but your team has only one Java developer, meaning you may need to increase the number of Java developers on your team.
What data do you need to add to this metric?
Ticket data (mandatory)
How to set up Backlog Health on Plandek
Select the ‘Active Work' metric (see guide). In the Calculation section, add all your Backlog work statuses. Now add at least one breakdown (i.e. Issue Type) and save. After saving, open the breakdown tab and select the ‘OVER TIME: STACKED CHART' option.
This is an example of a healthy, stable backlog:
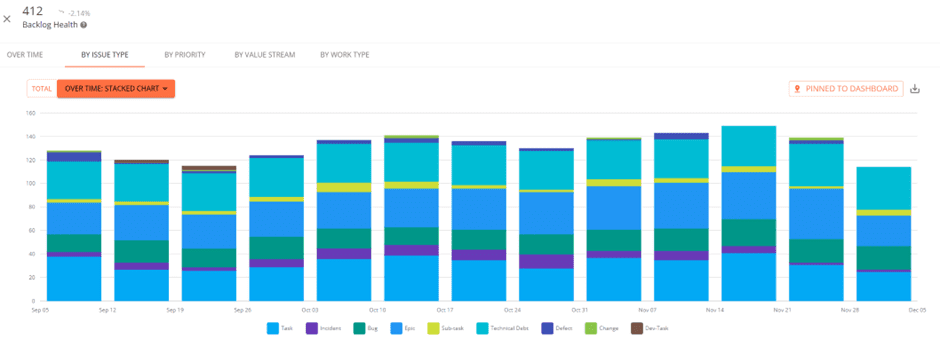
Backlog Health | Plandek Dashboard
6. Max WIP
Context switching is known to impact productivity and flow negatively. This is the same for development teams - working between different Tickets can be counter-productive and disruptive. For this reason, a common Kanban practice is to limit the number of Tickets in progress at any time. This metric will be able to give you an insight into your teams' WIP habits.
Why should you implement Max WIP?
Some common insights may be:
Validate if a team commits to too much work at once
Identify if a team member becomes overloaded with tasks
The metric may also highlight Ticket hygiene issues (i.e. Tickets are not being reassigned as appropriate)
What data do you need to add to this metric?
Ticket data (mandatory)
How to set up Max WIP on Plandek
Select the ‘Max WIP' metric (see guide). In the calculation section, select the 'In progress' statuses you want Plandek to consider in determining if a Ticket is in WIP. You can choose to break down this metric by anything that is meaningful for you and your organisation. However, as a suggestion, we'd opt for "By Assignee" and "By Board" as great starting points:
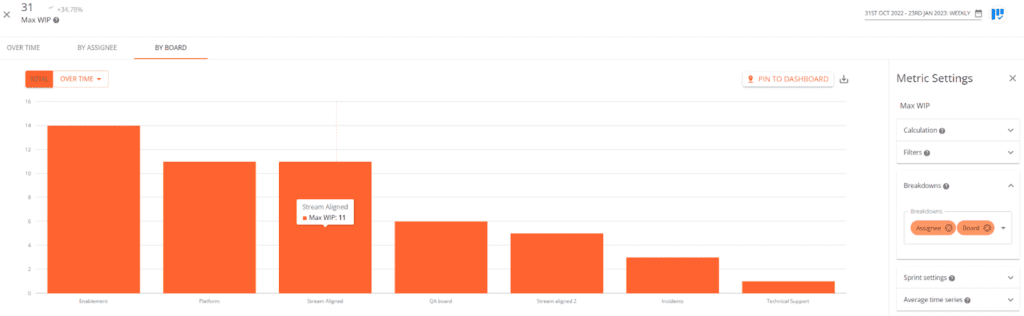
Max WIP | Plandek Dashboard
7. Flow Efficiency
Flow Efficiency is the ratio between your active time against the total Lead Time of Tickets.
To learn more about Flow Efficiency and the other Flow metrics, read this: Flow Efficiency
Why should you implement Flow Efficiency?
Tracking your Flow Efficiency will help you with the following:
It helps you measure your ratio of active to inactive time spent on average per Ticket, indicating the health of your Ticket flow
Will highlight if frequent blockers are pushing Tickets into queues and slowing down the Lead Time
Trends of efficiency/inefficiency are made very clear
What data do you need to add to this metric?
Ticket data (mandatory)
How to set up Flow Efficiency on Plandek
Select the ‘Flow Efficiency' metric (see guide). In the calculation section, select the statuses where the Ticket is actively being worked on and save. By default, there are two views – Overtime and By Status. You can view other chart times, i.e. OVER TIME: 100% STACKED:
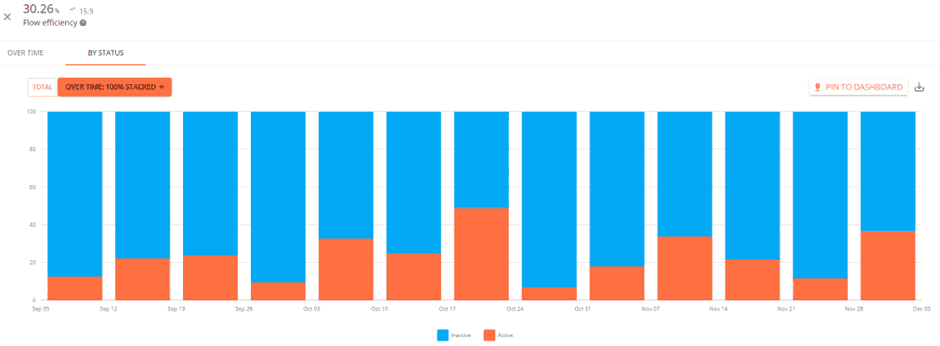
Flow Efficiency Ratio | Plandek Dashboard
8. Frequency of Deployments
With 'Just in Time' at the centre of Kanban's methodology, continuous delivery is an important component to measure. Summarised as a number of deployments per day, this is a great core metric to monitor as you strive towards shorter Lead Times and continuous delivery.
To learn more about the Frequency of Deployments, as well as the other DORA metrics, read this: Deployment Frequency
Why should you implement Frequency of Deployments?
Aside from tracking the standard Frequency of Deployments, use the metric to:
Identify your most active pipelines
Pinpoint your busiest deployment days
Compare the number of successful vs unsuccessful deployments
Trace unsuccessful deployments back to the pipelines to check for correlation
What data do you need to add to this metric?
Deployment data (mandatory)
How to set up Frequency of Deployments on Plandek
This metric is straightforward to set up. Simply select the 'Frequency of Deployments' metric (see guide). You can optionally add a breakdown, such as a deployment pipeline.
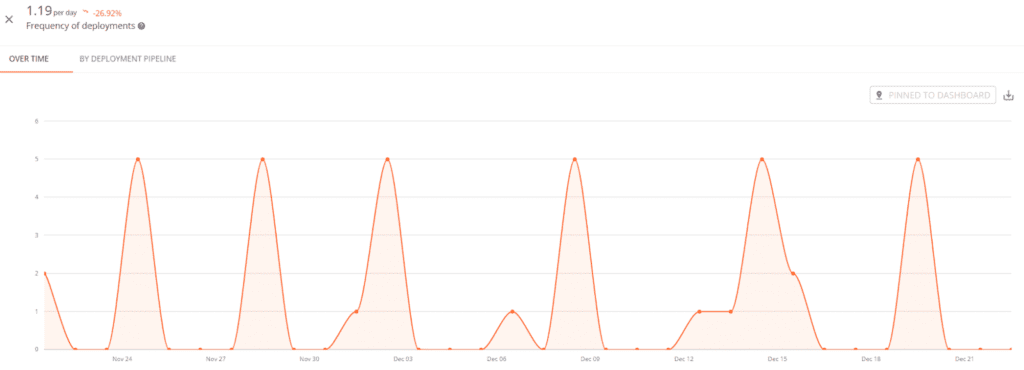
Frequency of Deployments | Plandek Dashboard
9. Bonus metric: Ticket Flow
When you wish to monitor the progress of an individual project, fix version, release or epic, Ticket Flow is a great way to identify the week-by-week status of your Tickets.
If you want to learn more about how you can track your Epics, read here: Overcoming Software Development Challenges by Tracking Epics | Plandek
Why should you implement Ticket Flow?
Providing a cumulative flow of the epic with a daily or weekly breakdown, the metric can tell you:
The increase in Tickets in the Epic
The progress of project completion
How the Tickets are moving through the workflow status
When the flow has become blocked
What data do you need to add to this metric?
Ticket data (mandatory)
How to set up Ticket Flow on Plandek
Select the ‘Ticket Flow' metric (see guide). Simply add an Epic Name (or Fix Version or Release or Project) filter, select the epic you want to track and save.
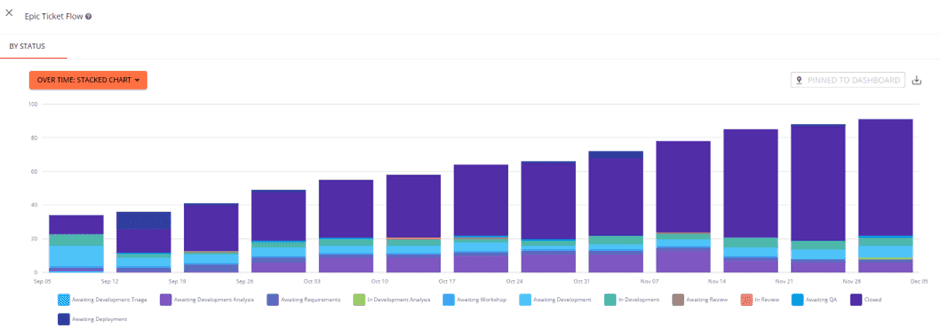
Epic Ticket Flow | Plandek Dashboard
Keep learning about metrics
Written by
Charlie Ponsonby
Co-founder & CEO
Charlie Ponsonby is CEO and Co-founder of Plandek, the leading Developer Productivity Insight (DPI) platform that helps software engineering teams drive productivity and transition to AI-led engineering. He writes widely on the opportunities and challenges inherent in the transition to the agentic SDLC. Prior to founding Plandek, Charlie founded Simplydigital, which grew to become the UK's largest broadband and digital services comparison business before being acquired by Europe's largest consumer electronics retailer. He started his career at Accenture and has held senior leadership roles in retail and telco. Charlie holds a degree from the University of Cambridge.


See how your engineering efforts translate into measurable business impact
Measure delivery performance, AI impact, and engineering productivity with hundreds of metrics, OOTB dashboards and custom configurations.


Contact us
UK Office
Unit 313 The Print Rooms, 164-180
Union St, London SE1 0LH
US Office
Floor 4, 1515 Mockingbird Ln,
Charlotte, NC 28209, USA