

Flow Distribution - Metric Definition
Flow Distribution is a very useful software delivery metric. As its name suggests, it is one of the Flow Metrics often adopted as part of a Value Stream Management approach to software delivery.
The five most commonly used Flow Metrics are:
Flow Distribution
Flow Load
Flow Time
Flow Velocity
All five flow metrics consider software delivery as an end-to-end process (from ideation to delivery to live) and measure the effectiveness of this process in its entirety.
Flow Distribution is essentially an analysis of Throughput (another common software delivery metric). Flow Distribution looks at the distribution of tickets currently in progress (rather than completed tickets) – and shows the business areas, products (or value streams) within which these in-progress tickets sit.
As such, Flow Distribution shows you where effort is currently being expended across your software delivery teams. This is vital for ensuring that resource is focused on strategic priorities and not being diverted to less productive tasks (such as addressing technical debt or fixing bugs).
In addition, Flow Distribution shows at what stage in the delivery cycle these in-flight tickets sit (e.g. in progress, awaiting QA, in test etc.).
Example - Flow Distribution summary chart
The example Flow Distribution summary chart below shows the tickets opened by the Jira Board or delivery area so that the balance of in-progress work is clearly visible.
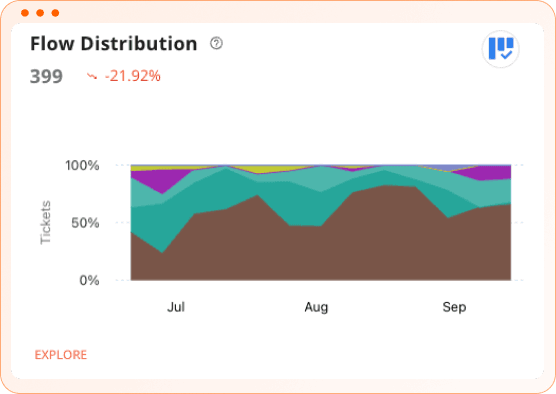
Clearly, the measurement of Flow Distribution is dependent on how teams and work are organised. This may be by team, product, value stream or project, for example.
Agile delivery metrics platforms like Plandek enable teams to analyse the root cause of Flow Distribution issues.
Key use cases of Flow Distribution
Flow Distribution is a useful agile metric at all levels of the delivery organisation. Individual teams can use Flow Distribution to track the balance of work at the team level, but also, very importantly, Delivery and Product Managers can track the balance of work across teams, products and value streams.
Use cases of Flow Distribution include:
Immature agile delivery teams start out with an Agile methodology and look for a set of metrics to track their growing effectiveness over time.
High-performing, agile delivery teams focused on implementing a Value Stream Management methodology to track and drive the delivery of value to their customers.
Larger (e.g. Scaled Agile) delivery environments where individual teams need to work together to deliver a shared objective. This may involve many interdependencies between teams across multiple.
Programme Increments. Hence, understanding whether teams are actually expending effort on the core value delivery objectives becomes critical to delivering an environment of accelerating value delivery over time.
Related Flow Metrics
As mentioned above, Flow Distribution is one of five commonly used Flow Metrics in software delivery analytics. The Flow Metrics consider software delivery as an end-to-end process – from ideation through to delivery to live. As such, Flow Metrics are commonly adopted as part of effective Value Stream Management within software delivery teams.
The other four Flow Metrics closely associated with Flow Distribution are: Flow Load, Flow Efficiency, Flow Time and Flow Velocity.
Flow Load analyses the number of tickets (flow items) currently in progress across different value streams or product areas. As such, it is a good measure of utilisation.
Flow Efficiency considers the proportion of time tickets spend in an ‘active' versus ‘inactive' status) and is a great Agile metric for teams. Flow Efficiency analysis enables Team Leads to isolate and analyse each ‘inactive' status in the workflow and consider if there is scope to reduce or eliminate it. The analysis shows the relative size of each ‘inactive' status opportunity in terms of time spent in the inactive state and the volume of tickets affected.
Flow Time considers the total time taken for work items to be delivered – from ‘work start' to ‘work complete'. It is a similar, if not identical, measure to Lead Time or Lead Time to Value. As such, it is a fundamental agile delivery metric as it measures the time taken to deliver an increment of software, from design to delivery, into customers' hands. This is itself the central tenet of Agile software delivery – described in the Agile Manifesto as ‘the early and continuous delivery of valuable software'.
Flow Velocity is a measure of agile delivery velocity. It measures the number of flow items (tickets) completed over a time period. It is, therefore, often adopted alongside Flow Distribution.
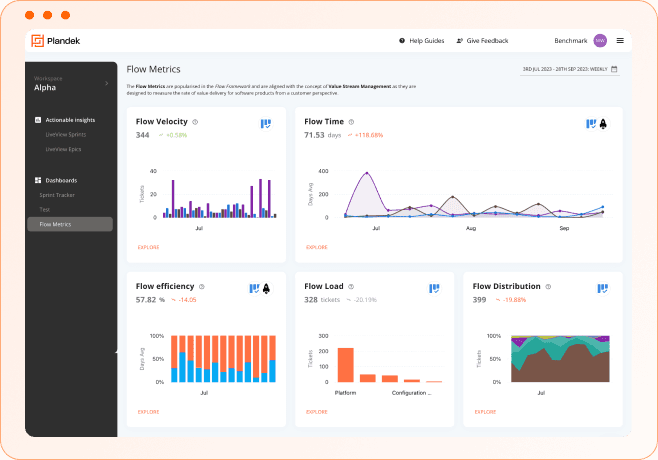
How to Measure Flow Metrics in Plandek - Flow Metrics Dashboard
Plandek provides the ability to measure your Flow metrics all in one place using our Flow Dashboard, where you can keep track of a combination of Flow metrics including Flow Velocity, Flow Time, Flow Efficiency, Flow Load and Flow Distribution.
It's easy to set up and get started with measuring Flow metrics in Plandek - simply book a demo with our team and we'll help you get started.
Continue learning about metrics
Written by
Charlie Ponsonby
Co-founder & CEO
Charlie started his career as an economist working on trade policy in the developing world, before moving to Accenture in London. He joined the Operating Board of Selfridges, before moving to Open Interactive TV and then Sky where he was Marketing Director until leaving to found Simplifydigital in 2007. Simplifydigital was three times in the Sunday Times Tech Track 100 and grew to become the UK’s largest TV, broadband and home phone comparison service, powering clients including Dixons-Carphone, uSwitch and Comparethemarket. It was acquired by Dixons Carphone plc in April 2016. He co-founded Plandek with Dan Lee in 2018. Charlie was educated at Cambridge University. He lives in London and is married with three children.


See how your engineering efforts translate into measurable business impact
Measure delivery performance, AI impact, and engineering productivity with hundreds of metrics, OOTB dashboards and custom configurations.


Contact us
LONDON - HQ
Unit 313 The Print Rooms, 164-180
Union St, London SE1 0LH