

Do you actually need to be tracking Epics? Why?
As opposed to just being a large-scale project, Epics can be incredibly valuable sources of information when it comes to tracking and reporting. Plandek, when integrated with the toolset used to deliver your Epic, can provide you with a multitude of metrics to help you track and spot risks in the delivery of Epics/Features.
We've spent some time thinking about the most common challenges teams face when delivering Epics. In this article, you'll find some of the most common challenges teams face during Epics, as well as matching insights that will help you navigate them. Ultimately, this article should help you deliver your Epic on time.
Challenge 1: Setting up metrics to make sense of Epics
It’s as simple as this: select Epic Name from the filters in the metric settings and choose the epic you want to report on. If you don’t see this as an option, simply ask your Plandek Admin to add it.
Alternatively, if you're interested in seeing data across a range of Epics, select Epic Name in the breakdown setting.
It’s worth noting that Plandek will not only show you all the direct children of Epics (i.e. Stories, Bugs and Tasks), but when we process your Tickets, your subtasks will also inherit the Epic Name attribute so they too will be available when you filter by Epic Name.
Challenge 2: Making sense of underpinning delivery time for Epics
See how long it takes for all of the Stories, Bugs, and Tasks to be delivered under your Epic.
It's important to track the time it takes to deliver changes to:
Ensure the Epic is on track.
To spot if the trend starts increasing over time
Spot any outliers which might lead to some important lessons learnt
As shown in the product image above, you need to choose your Epic and break down the data by issue type to see a scatter graph of the associated Tickets.
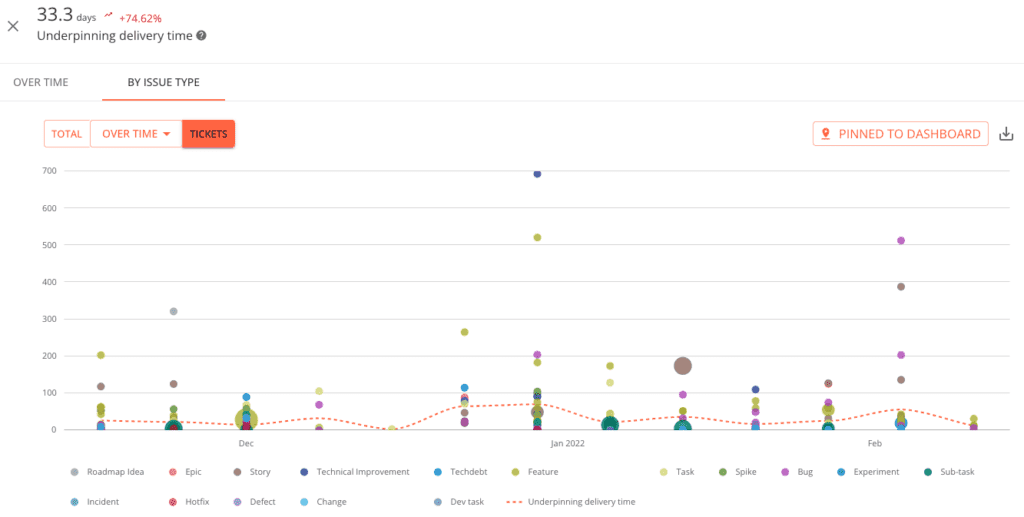
Underpinning Delivery Time | Plandek Dashboard
Challenge 3: Making sense of Epics progress using Stories
You can paint an accurate picture of your Epic's progress by comparing the overall burndown of your Stories with the Stories yet to be estimated.
Burndown charts help teams visually track the completion of work by charting the remaining work. By overlaying the unestimated Stories onto your burndown it will highlight potential bottlenecks made up of unestimated work, and progress, therefore, is not what it might seem to be.
Don’t worry if you don't use Story Points in your Epic: this metric can be changed to look at various types of burndowns, such as Tickets resolved vs remaining. If you use time estimates, you would draw a picture similar to Story Points, just set the calculation setting to the appropriate time field (e.g., time estimate).
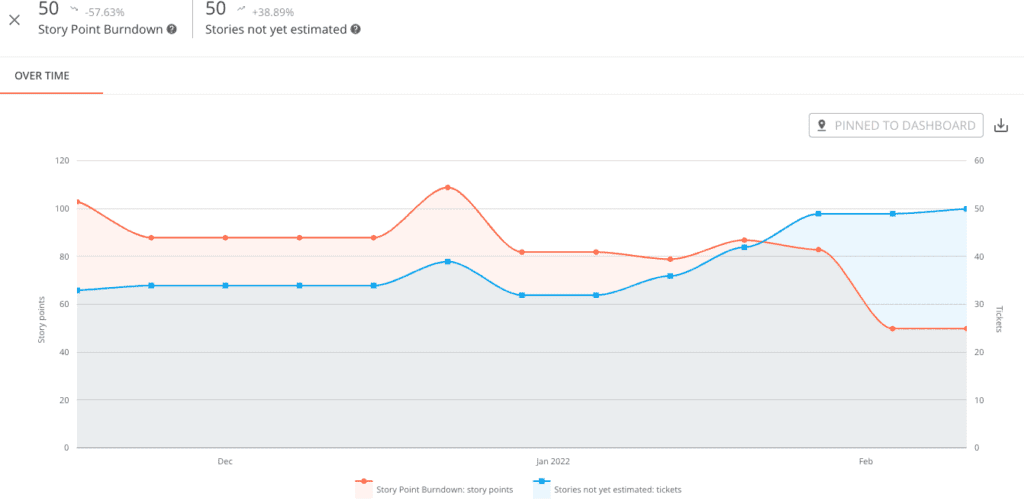
Story Point Burndown | Plandek Dashboard
Challenge 4: Understanding the Ticket Flow for your Epics
If you're concerned about the throughput of your Epic, use your available Ticket data.
You'll be able to see the cumulative flow of your Tickets either at a daily or a weekly level, giving you visibility of progress and highlighting any bottlenecks that may appear.
Look across all statuses, or you can choose to filter out statuses such as Done or Complete to give you a clearer view of the various “in-flight” statuses.
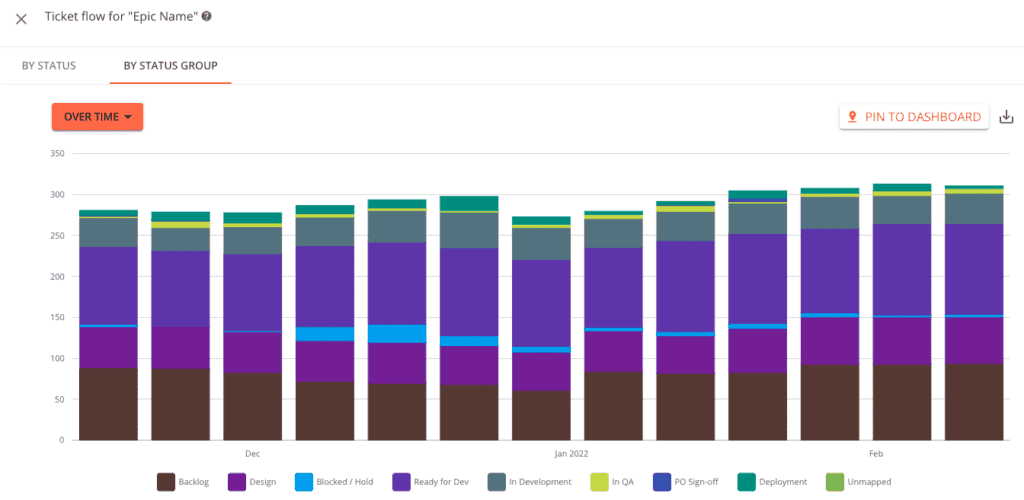
Ticket Flow for 'Epic Name' | Plandek Dashboard
Challenge 5: Tracking general delivery time for Epics using Mean Time to Merge PRs
Review how long it takes on average to review, approve and merge all Pull Requests associated with your Epic.
This complements Delivery Time and can help you identify any unusual events (e.g. PRs sitting in a review state for a long period), which will cause the overall cycle time to increase.
Filter by merged state so you can focus on only the PRs that have been merged. You can also use the Created Pull Requests metric and apply a filter on “open” PRs to ensure the team is responsive in real-time.
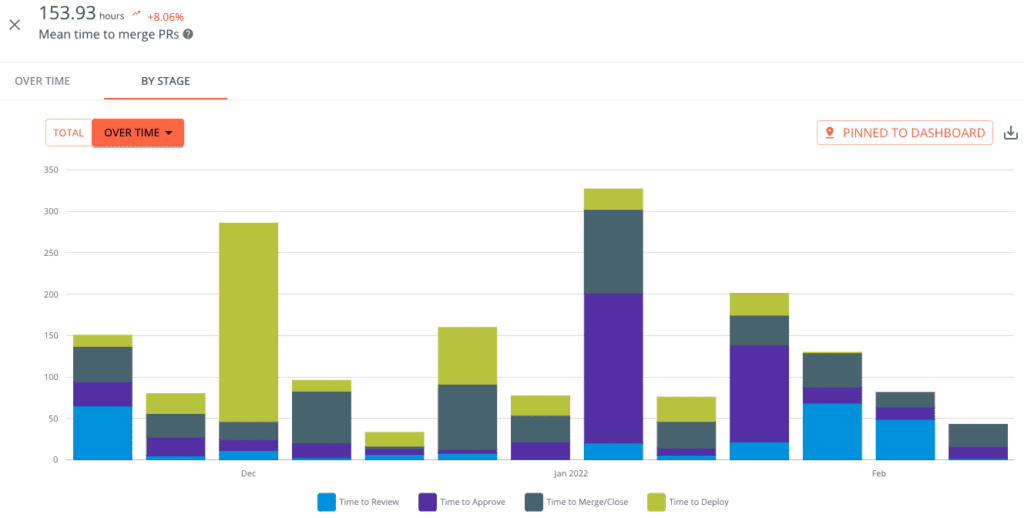
Mean Time to Merge PRs | Plandek Dashboard
Challenge 6: Utilising Changes to Code and Code Knowledge to track progress
Whilst this might not be something that sits in the front of your mind when thinking about tracking progress, Plandek’s engineering metrics can help you determine what areas of the code base are being changed as part of the Epic. Plandek can also highlight if there is a single point of failure when it comes to knowledge of the changes.
You’ll not only be able to spot if there are only one or two engineers working on the changes, but you can ensure that the knowledge of the changes is shared across the whole engineering team. You’ll also have valuable information to pass on to a QA team or a Support function.
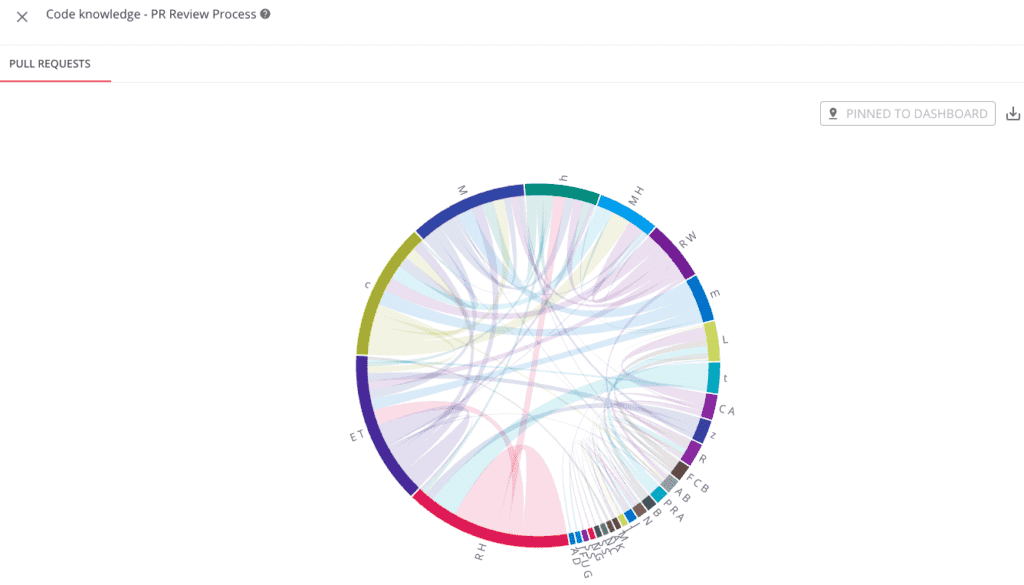
Pull Requests | Plandek Dashboard
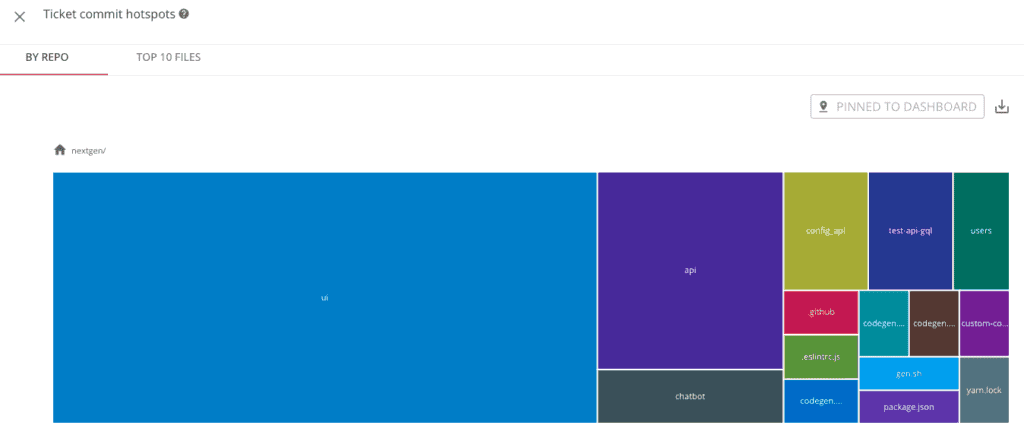
Ticket Commit Hotspots | Plandek Dashboard
Realistically, the list of available metrics is endless. Choosing relevant metrics is made even harder when you consider the fact that programme managers, delivery managers, and engineering leads all have different priorities.
When you utilise the potential of Plandek, you are immediately empowered to explore – and capitalise upon – everyone's priorities and strengths.
To help you visualise what Plandek can do for your SDLC, we've created two Epic templates: one is focused on using Story Points to drive the metrics, and the other is focused on the Tickets themselves. Try these templates out now using Plandek's smaller-scale, free platform.
About Plandek
Plandek is an intelligent analytics platform that helps software engineering teams deliver value faster and more predictably.
Plandek mines data from delivery teams’ toolsets and gives them the opportunity to optimise their delivery process using both intelligent insights and predictive analytics.
Co-founded in 2017 by Dan Lee (founder of Globrix) and Charlie Ponsonby (founder of Simplifydigital), Plandek is based in London and currently services the UK, Europe and North America.
Find out more about Plandek here: The Plandek Difference.
Written by
Charlie Ponsonby
Co-founder & CEO
Charlie started his career as an economist working on trade policy in the developing world, before moving to Accenture in London. He joined the Operating Board of Selfridges, before moving to Open Interactive TV and then Sky where he was Marketing Director until leaving to found Simplifydigital in 2007. Simplifydigital was three times in the Sunday Times Tech Track 100 and grew to become the UK’s largest TV, broadband and home phone comparison service, powering clients including Dixons-Carphone, uSwitch and Comparethemarket. It was acquired by Dixons Carphone plc in April 2016. He co-founded Plandek with Dan Lee in 2018. Charlie was educated at Cambridge University. He lives in London and is married with three children.


See how your engineering efforts translate into measurable business impact
Measure delivery performance, AI impact, and engineering productivity with hundreds of metrics, OOTB dashboards and custom configurations.


Contact us
LONDON - HQ
Unit 313 The Print Rooms, 164-180
Union St, London SE1 0LH