
The DORA metrics platform
Plandek does more than just track DORA metrics – it turns them into actionable insights, automated improvements, and predictable delivery at scale.
Powering the world’s best product teams.
From next-gen startups to established enterprises.























Powering the world’s best product teams.
From next-gen startups to established enterprises.
DORA metrics are the start.
Plandek makes them strategic.
DORA metrics are the start.
Plandek makes them strategic.
DORA metrics are industry standards for DevOps performance. But tracked in isolation, they’re just that – standards. Plandek brings context, causality, and continuous improvement to DORA tracking by enriching these metrics with deep SDLC visibility, predictive analytics, and workflow automation.
DORA metrics are industry standards for DevOps performance. But tracked in isolation, they’re just that – standards. Plandek brings context, causality, and continuous improvement to DORA tracking by enriching these metrics with deep SDLC visibility, predictive analytics, and workflow automation.
DORA metrics are industry standards for DevOps performance. But tracked in isolation, they’re just that – standards. Plandek brings context, causality, and continuous improvement to DORA tracking by enriching these metrics with deep SDLC visibility, predictive analytics, and workflow automation.
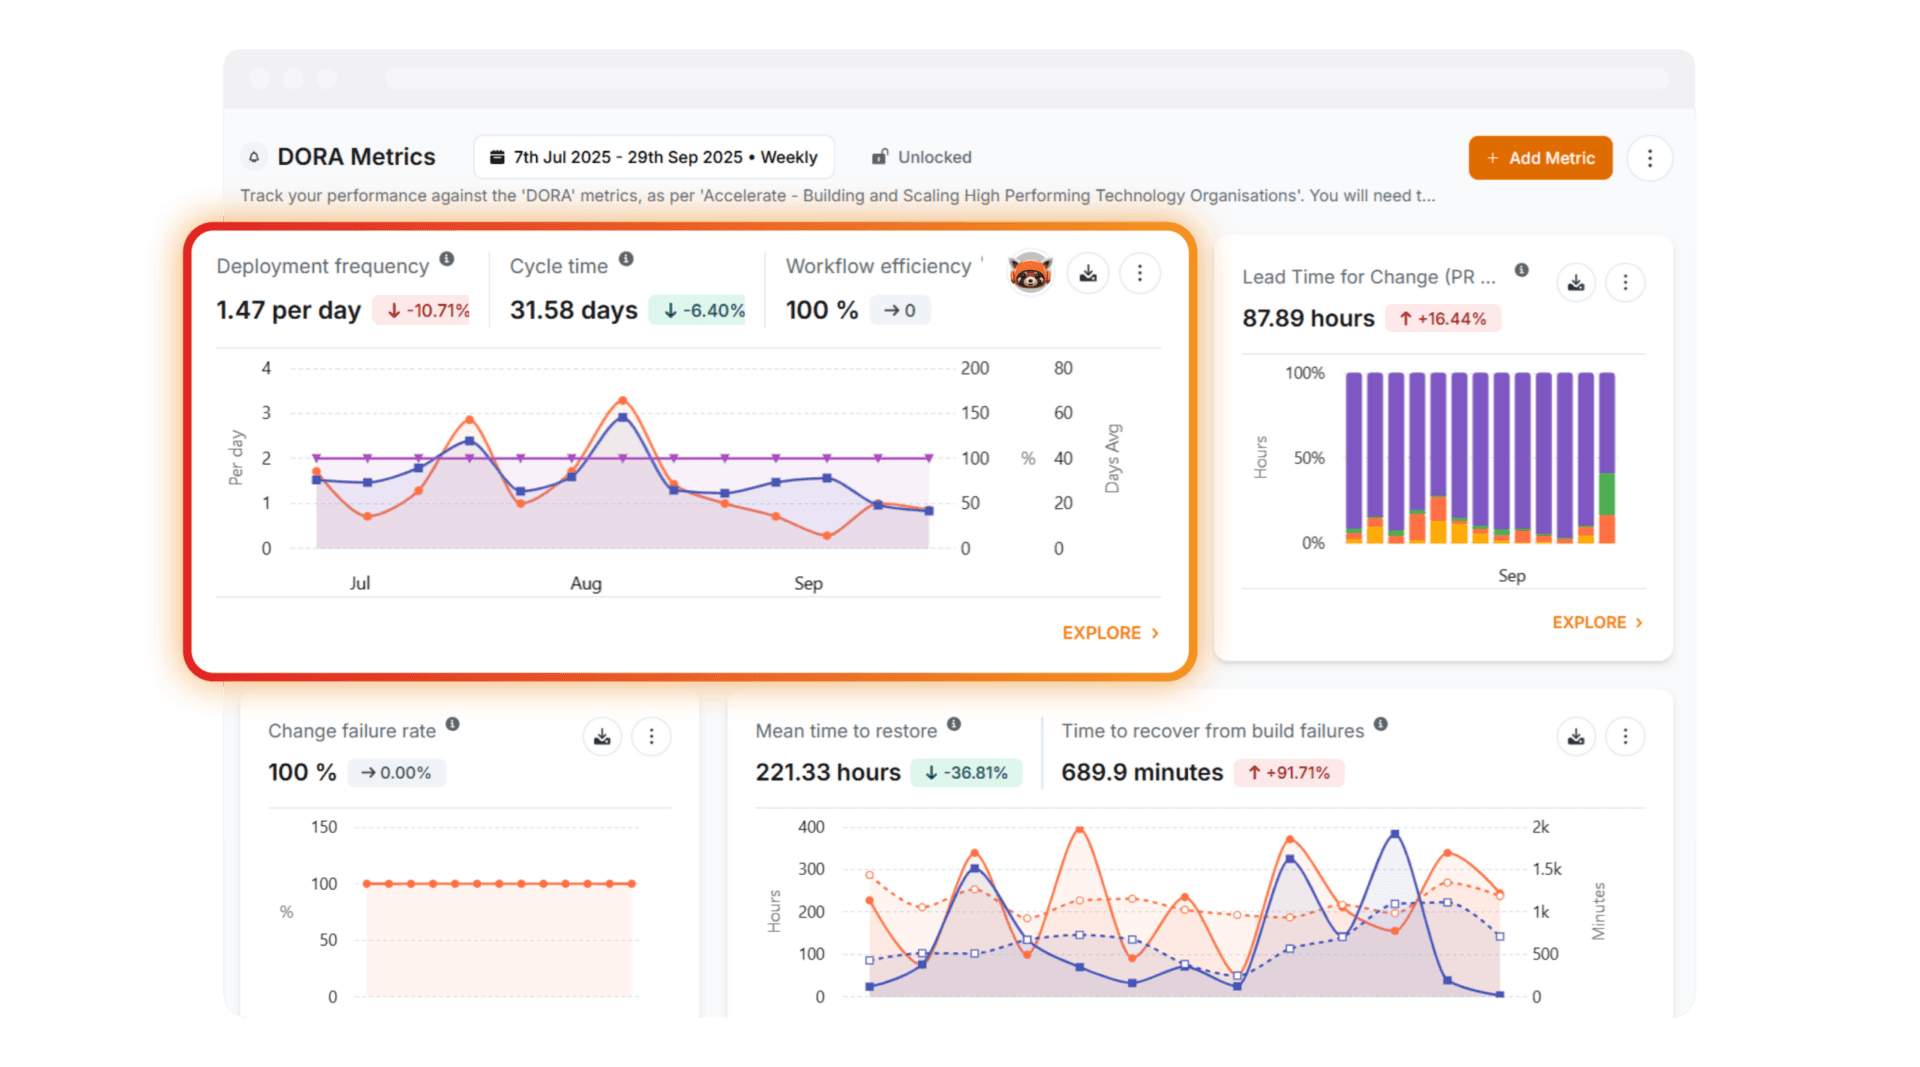
The Four DORA Metrics
Deployment Frequency
Deployment Frequency
AKA: DF, Deploy Frequency. How often code is successfully deployed to production (or released to end users).
AKA: DF, Deploy Frequency. How often code is successfully deployed to production (or released to end users).
Change Failure Rate
Change Failure Rate
AKA: CFR, and Change Fail Percentage. The percentage of deployments that cause a failure in production requiring remediation.
AKA: CFR, and Change Fail Percentage. The percentage of deployments that cause a failure in production requiring remediation.
Lead Time for Changes
Lead Time for Changes
AKA: LTC, LTFC. The time from when code is committed to when it is successfully running in production.
AKA: LTC, LTFC. The time from when code is committed to when it is successfully running in production.
Mean Time to Restore Service
Mean Time to Restore Service
AKA: MTTR, Mean Time to Recover. How long it takes an organization to restore service after a production failure.
AKA: MTTR, Mean Time to Recover. How long it takes an organization to restore service after a production failure.
Intelligent insights from your
DORA metrics platform
Intelligent insights from your DORA metrics platform
Quickly surface the DORA metrics
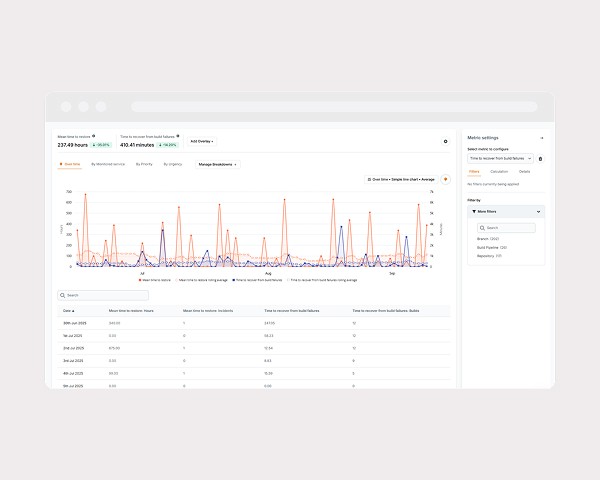
Plandek’s DORA dashboard template surfaces DORA metrics for analysis and drill-down.
Using Plandek’s flexible workspace functionality – DORA metrics can be viewed at multiple levels within your delivery organization (e.g. by product, value stream, release train etc).
Plandek’s DORA dashboard template surfaces DORA metrics for analysis and drill-down.
Using Plandek’s flexible workspace functionality – DORA metrics can be viewed at multiple levels within your delivery organization (e.g. by product, value stream, release train etc).
Quickly surface the DORA metrics
Plandek’s DORA dashboard template surfaces DORA metrics for analysis and drill-down.
Using Plandek’s flexible workspace functionality – DORA metrics can be viewed at multiple levels within your delivery organization (e.g. by product, value stream, release train etc).
Track & drive the underlying DORA metrics
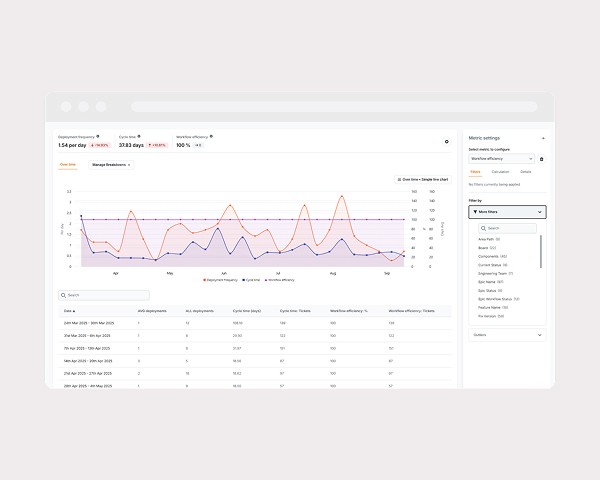
Plandek’s ‘single pane of glass’ looks across the whole SDLC. It therefore enables you to track and drive improvement in the ‘second order’ metrics that result in improvement in the DORA metrics.
Deployment Frequency is influenced by Cycle Time and Flow Efficiency for example, and will only be improved by interventions in multiple ways across the SDLC as a whole.
Plandek’s ‘single pane of glass’ looks across the whole SDLC. It therefore enables you to track and drive improvement in the ‘second order’ metrics that result in improvement in the DORA metrics.
Deployment Frequency is influenced by Cycle Time and Flow Efficiency for example, and will only be improved by interventions in multiple ways across the SDLC as a whole.
Track & drive the underlying DORA metrics
Plandek’s ‘single pane of glass’ looks across the whole SDLC. It therefore enables you to track and drive improvement in the ‘second order’ metrics that result in improvement in the DORA metrics.
Deployment Frequency is influenced by Cycle Time and Flow Efficiency for example, and will only be improved by interventions in multiple ways across the SDLC as a whole.
Improve with a full-spectrum DORA Metrics platform
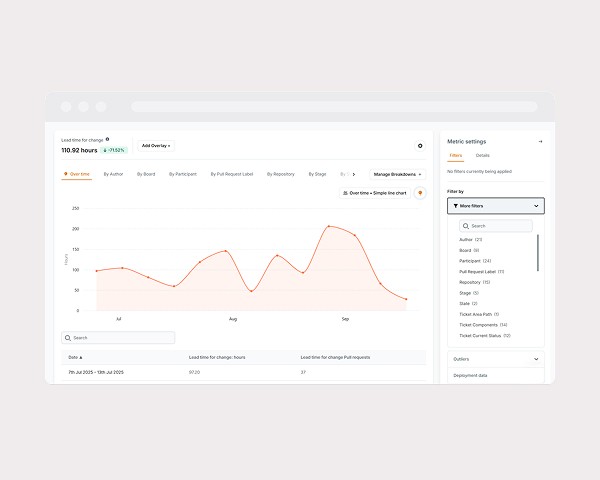
Plandek helps you surface DORA metrics across every level of your delivery organization, while also providing the second-order delivery and engineering metrics you need to truly move the needle on DORA performance.
Plandek helps you surface DORA metrics across every level of your delivery organization, while also providing the second-order delivery and engineering metrics you need to truly move the needle on DORA performance.
Improve with a full-spectrum DORA Metrics platform
Plandek helps you surface DORA metrics across every level of your delivery organization, while also providing the second-order delivery and engineering metrics you need to truly move the needle on DORA performance.

If you want to know if engineering is running efficiently, Plandek gives you the complete picture. If I could take one product with me to a new company, it would be Plandek, and I did that when I joined PEI Group.

Darren Thorpe
Chief Product Officer, PEI Group

As we accelerated with AI, we’d see productivity improve, then plateau. Plandek helped us identify the next high-value constraint so we could unlock the next stage of improvement.

Beccy Weeks
Chief AI Officer, Citation

We’ve been really able to demystify what was once previously a really complex engineering process… and really build a better conversation around what it means to build good product software.

Gary Stevens
Director of Engineering, Trainline

Predictability, while good, isn’t what we’re trying to optimise now. It is about speed to market. It will become table stakes: if you’re a technology business, you should be able to deliver software in no time at all. If you can’t, there’s a business problem looming.

James Cameron-Williams
CPTO, OAG

The data provides a mirror. It’s not just showing us where the problems are, it gives us the starting point for the conversations we need to have with our teams.

Niklas Lundborg
CTO, Bokio

Plandek provides industry experts who tailor to our needs… Plandek are leaders in this space so we need to tap into this experience.

Daniel Pierce
Sr Director of Data & Analytics, Sage
If you want to know if engineering is running efficiently, Plandek gives you the complete picture. If I could take one product with me to a new company, it would be Plandek, and I did that when I joined PEI Group.
Darren Thorpe
Chief Product Officer, PEI Group
As we accelerated with AI, we’d see productivity improve, then plateau. Plandek helped us identify the next high-value constraint so we could unlock the next stage of improvement.
Beccy Weeks
Chief AI Officer, Citation
We’ve been really able to demystify what was once previously a really complex engineering process… and really build a better conversation around what it means to build good product software.
Gary Stevens
Director of Engineering, Trainline
Predictability, while good, isn’t what we’re trying to optimise now. It is about speed to market. It will become table stakes: if you’re a technology business, you should be able to deliver software in no time at all. If you can’t, there’s a business problem looming.
James Cameron-Williams
CPTO, OAG
The data provides a mirror. It’s not just showing us where the problems are, it gives us the starting point for the conversations we need to have with our teams.
Niklas Lundborg
CTO, Bokio
Plandek provides industry experts who tailor to our needs… Plandek are leaders in this space so we need to tap into this experience.
Daniel Pierce
Sr Director of Data & Analytics, Sage
If you want to know if engineering is running efficiently, Plandek gives you the complete picture. If I could take one product with me to a new company, it would be Plandek, and I did that when I joined PEI Group.
Darren Thorpe
Chief Product Officer, PEI Group
As we accelerated with AI, we’d see productivity improve, then plateau. Plandek helped us identify the next high-value constraint so we could unlock the next stage of improvement.
Beccy Weeks
Chief AI Officer, Citation
We’ve been really able to demystify what was once previously a really complex engineering process… and really build a better conversation around what it means to build good product software.
Gary Stevens
Director of Engineering, Trainline
Predictability, while good, isn’t what we’re trying to optimise now. It is about speed to market. It will become table stakes: if you’re a technology business, you should be able to deliver software in no time at all. If you can’t, there’s a business problem looming.
James Cameron-Williams
CPTO, OAG
The data provides a mirror. It’s not just showing us where the problems are, it gives us the starting point for the conversations we need to have with our teams.
Niklas Lundborg
CTO, Bokio
Plandek provides industry experts who tailor to our needs… Plandek are leaders in this space so we need to tap into this experience.
Daniel Pierce
Sr Director of Data & Analytics, Sage
See how your engineering efforts translate into measurable business impact
Measure delivery performance, AI impact, and engineering productivity with hundreds of metrics, OOTB dashboards and custom configurations.












Platform
Platform
Contact us
UK Office
Unit 313 The Print Rooms, 164-180
Union St, London SE1 0LH
US Office
Floor 4, 1515 Mockingbird Ln,
Charlotte, NC 28209, USA