


This article is from our archives. Browse our articles to see what we’re talking about now, or take a look at what Plandek can do to improve software delivery and enable your AI transition today.
Key Takeaways
Agile teams often deliver major milestones that the business expects at a certain point and for an agreed budget, so they will need to forecast or risk being accused of being “Agile and late”.
Logic dictates that there are six possible reasons why a project is late – the “Logical Six”. Three in the control of the technology team: underestimation of effort, lack of available talent, and lack of team productivity. Three in the control of sponsors: unclear requirements, scope change, and lack of required ongoing input.
There are metrics that relate to these six potential sources of delay – it is critical to measure these to improve forecasting accuracy.
These metrics require surfacing from multiple data sources and are, therefore, hard to see without an end-to-end delivery metrics/analytics platform.
These metrics can then be used to create a Root Cause Red/Amber/Green (RAG) Progress Report – to share with sponsors a more accurate forecast and clear mitigations, with allocated responsibilities to deliver the identified mitigations.
We work with Agile teams of all different shapes and sizes, and predictability is a front-of-mind theme for almost all – as the words "Agile" and "predictable" don’t always go hand in hand …
So, how can development teams maintain their Agility and improve their delivery predictability? So, when stakeholders ask the predictable question, "Are we on schedule?" they can give a sensible answer.
Typical Agile team forecasting approaches
Product-based Agile software development teams delivering small increments very regularly may spend little time worrying about forecasting.
But often, Agile teams are established to deliver major milestones that the business expects at a certain point and for an agreed budget, so they will need to forecast effectively or risk being accused of being "Agile and late!
In our experience, Agile teams’ forecasting tends to be pretty inaccurate. It is often based only on a simple observation of backlog, velocity and word-of-mouth reassurance from the teams themselves.
In our opinion, a really meaningful forecast requires a broader set of empirical data reflecting all the potential sources of project delay.
* There is a separate debate as to whether an Agile software development methodology is appropriate in a "project" context like this, but that is for another day.
"The Logical Six" – the six sources of project delay
Logic dictates that there are six possible reasons why a project is late – the so-called "Logical Six". Three of the Logical Six are in direct control of the technology team:
The size and complexity of the task is underestimated;
The planned group of appropriate engineers are not available;
The delivery team is not delivering as productively as anticipated.
And the other three are in control of the business sponsors interacting with the technology team. These are:
Unclear requirements definition – internal clients are not clear enough about what they actually want;
Scope change - the business moves the goal posts (changed/new requirements or changed priorities);
Ongoing input - the development process is delayed by a lack of stakeholder input where/when required.
In our view, you will never really be able to accurately forecast and improve your delivery predictability unless you collect metrics which track all of these six levers.
Only then will you really understand whether a project is likely to be "late" and what needs to be done to get it back on track?
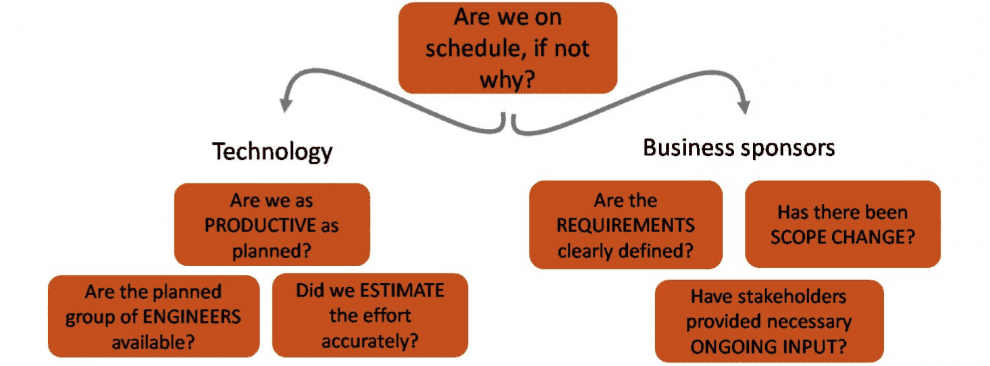
The "Logical Six" – the six ultimate sources of project delay
Challenging your teams’ forecasting with analysis of the delivery metrics that matter
So, what are the metrics that relate to the six sources of project delay – and are critical to delivery predictability and improved forecasting accuracy?
The table below shows our favourite metrics in each of the areas. We encourage Delivery Managers to focus on these when working with the Delivery Team Leads to create more realistic forecasts of delivery timing.
In summary, the metrics are:
People availability – clearly key. If we don’t have the engineers that we anticipated, we will be late.
Team productivity relating to:
Productive time – another critical metric considering the proportion of time engineers have to focus on writing new features.
Process efficiency - friction in the development process can undermine the best-laid delivery plans. So, really understanding trends and the causes of this friction is key.
Velocity and time to value – understanding how our throughput and time to value have varied as the project progresses is yet another determinant variable in our forecasting.
Estimation Accuracy - if we are adopting a Scrum-based approach– sprint completion gives a very good indicator of our forecasting capability. If we cannot hit our two-weekly sprint goals, we are unlikely to be effective at estimating effort and forecasting further into the future.
Requirements definition, stakeholder input and scope change can be tracked using Quant Engineer Feedback collected from collaboration hubs like Slack. This is something we use a lot internally to improve our forecasting as it uses quant insight from the people actually doing the work. It often adds confidence to an otherwise theoretical delivery forecast and sheds light on three of the Logical Six (requirements definition, stakeholder input and genuine scope change).
Key metrics to track the logical six levers of project delay
Trend Metrics | Relevance |
|---|---|
Available Engineering Resource: Active Engineers (v plan) | Clearly key – shows whether we have the planned resources in place to deliver the work. |
Productive Time | Key to understanding how this has trended over time. If we are spending more expending energy on non-productive tasks, clearly, this is going to impact our progress going forward. |
Process Efficiency | These metrics analyse the "friction" in the development process and how this has trended over time. Declining Flow Efficiency is a problem that can often be addressed, so it is a key metric in forecast mitigation. Rework shows trends in accumulated time spent reworking tickets that fail QA. This is another form of friction that may be mitigated (e.g. by assisting engineers new to the code base).NB: In our view, any metric collected at the individual level needs to be viewed in context by people directly involved in the project. They can be taken out of context (to damaging effect) if circulated more broadly. |
Velocity and Time to Value | Velocity metrics are problematic, but a detailed understanding of trends in tickets completed (and story points/value points per ticket) is key when challenging forecasts. Critical too is an understanding of changes in Cycle and Lead Times. If they are lengthening accurate forecasting is tricky. |
Sprint Accuracy Overall Completion Rate (%) | The inability to meet two weekly sprint goals makes forecasting over longer periods very difficult. These metrics are therefore critical to forecasting accuracy. |
Quant. Engineer feedback team morale | Some metrics platforms enable the real-time polling of engineers through collaboration hubs. This provides quant data: of engineers’ views on morale and process efficiency; and the impact of business sponsors’ requirements definition and ongoing input Team Lead feedback on stories added by business stakeholders that are additional to the original scope. |
Collecting the delivery metrics that matter
The key delivery metrics require surfacing data from a myriad of sources, including workflow management tools, code repos, and CI/CD tools – as well as collecting quant feedback from the engineering team themselves (via collaboration hubs).
The complexity of the data and multiple sources make this sort of data collection very time-consuming to do manually and really requires an end-to-end delivery metrics platform to do at scale.
Delivery metrics platforms are available, which consist of a data layer to collate and compile metrics from multiple data sources and a flexible UI layer to enable the creation of custom dashboards to surface the metrics in the desired format.
Using Root Cause RAG reporting to combine your delivery forecast and mitigation plan
If we use metrics to track and analyse the Logical Six drivers of project progress, we will get a much clearer picture of real project progress. By this, we mean:
A more realistic delivery forecast;
And clear mitigations that we can focus on if the forecast is seen as behind schedule.
The improved forecast and related mitigations can be presented together in a Root Cause Red, Amber and Green (RAG) Progress Report.
Root Cause RAG reports are far more effective than traditional RAG progress reporting, which often sheds very little light on actually why a project (with a required go-live date) is behind schedule and what needs to be done to bring it back on track.
In contrast to a traditional RAG approach, the Root Cause RAG Report (see the example below) clearly shows:
Our latest delivery forecast
The delivery metrics that support our forecast
Our mitigations (based around the Logical Six levers that drive project timing) – e.g. the need to increase productive time by reducing time diverted to upkeep; the need to improve Flow Efficiency by addressing the blockages in the dev process (e.g. QA wait time); or the need for improved stakeholder input (as shown in the quant engineer feedback)
Allocated responsibilities (across the development teams and stakeholders) to deliver the identified mitigations
Done well, Root Cause RAG Reports can be a really effective means of presenting our (more accurate) forecasts in a way that stakeholders can understand and, therefore, can be an important step in reducing lateness and bringing the technology team and the internal client much closer together.
As discussed, however, it relies on an understanding of the metrics that actually determine project lateness and a means of collecting those metrics.
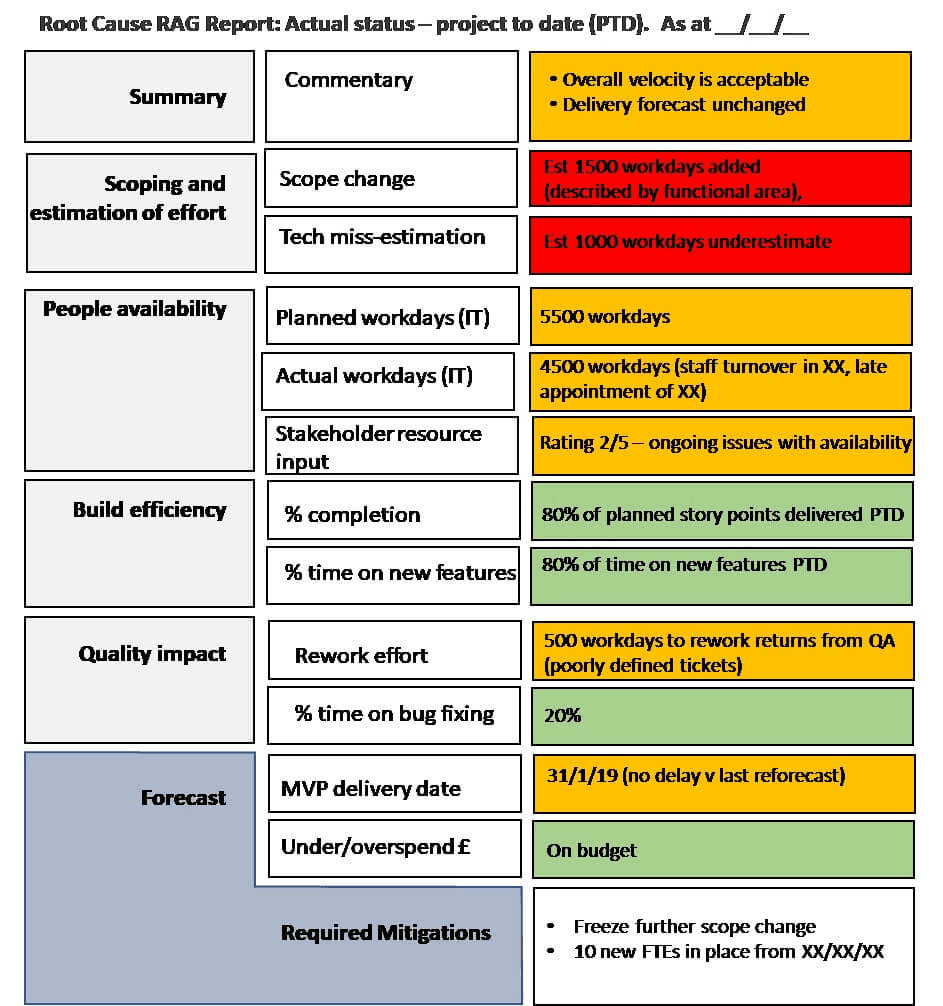
Example Root Cause RAG Report
This article was originally published on InfoQ.
Written by
Charlie Ponsonby
Co-founder & CEO
Charlie Ponsonby is CEO and Co-founder of Plandek, the leading Developer Productivity Insight (DPI) platform that helps software engineering teams drive productivity and transition to AI-led engineering. He writes widely on the opportunities and challenges inherent in the transition to the agentic SDLC. Prior to founding Plandek, Charlie founded Simplydigital, which grew to become the UK's largest broadband and digital services comparison business before being acquired by Europe's largest consumer electronics retailer. He started his career at Accenture and has held senior leadership roles in retail and telco. Charlie holds a degree from the University of Cambridge.


See how your engineering efforts translate into measurable business impact
Measure delivery performance, AI impact, and engineering productivity with hundreds of metrics, OOTB dashboards and custom configurations.


Contact us
UK Office
Unit 313 The Print Rooms, 164-180
Union St, London SE1 0LH
US Office
Floor 4, 1515 Mockingbird Ln,
Charlotte, NC 28209, USA