Accelerate your delivery. Join our Metrics Masterclass webinar to unlock the power of Speed metrics to move faster and deliver smarter. Register now>
Plandek vs Azure DevOps reporting
Looking for a better alternative to Azure DevOps reporting?
Plandek connects the dots across the entire SDLC and provides teams, managers and technology leaders with engineering insights to drive performance improvement and accelerate value delivery. Build your first report in minutes!
Build custom reports to find the answers to your engineering questions
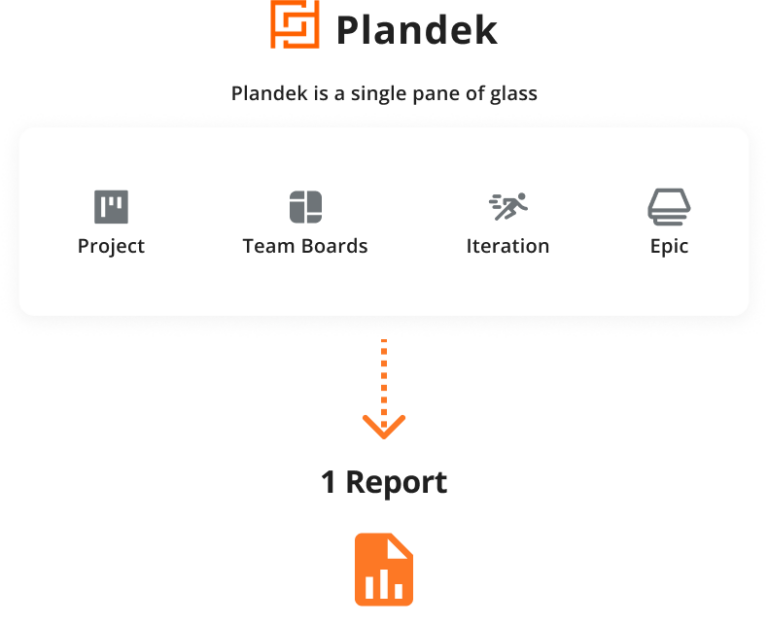
Plandek provides powerful insight you won't find in Azure DevOps
Plandek’s ability to track increments of work across your DevOps toolset enables it to provide crucial insight not available in ADO custom reports. Examples include:
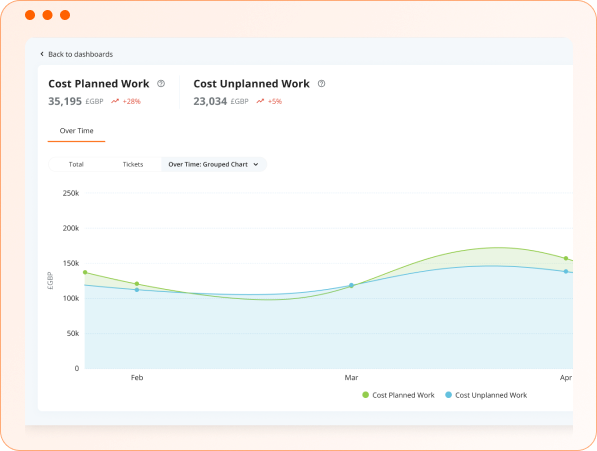
DORA metrics and Flow metrics - Plandek surfaces these metrics at all levels in your organisation and provides powerful drill-down and related determinant metrics to drive improvement.
Lead Time to Value - track and optimise the key Agile metric - the time taken from design through to delivery to live.
Ticket Hotspots - See where work is happening in your repositories to identify areas of code more susceptible to bugs than others.
Code Knowledge - Learn how team members interact with other in the pull request process.
Plandek provides insight at all levels in your organisation
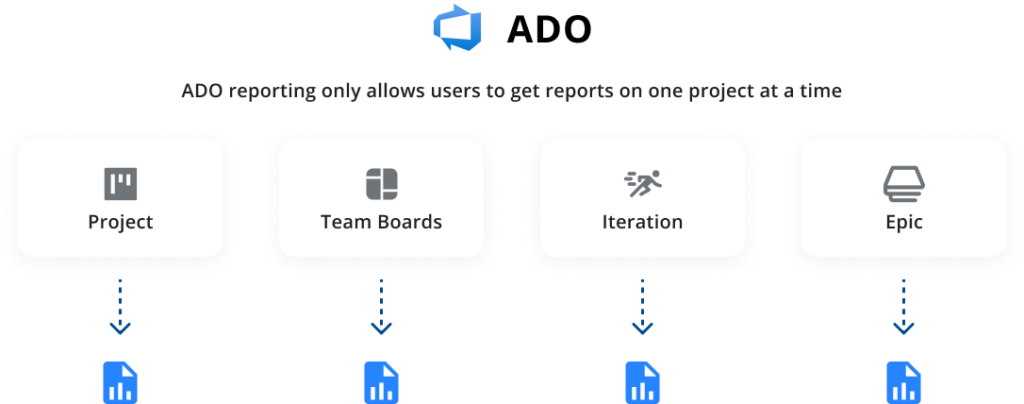
Plandek works across complex organisations allowing you to model the data from all these tools in the way that fits your structure, whereas Azure DevOps silos how you can report.
Align and manage success and challenges across your organisation with a shared view of the SDLC. We understand that every team within an organisation can be different, which is why Plandek offers flexibility at a team level while still maintaining transparency throughout the organisation.
Connect the dots across your toolchain with Plandek
Unlike Azure DevOps, Plandek provides visibility from design to delivery to live by integrating across your toolchain.
This allows team leads to get more insight around the Pull Requests, deployments and builds related to the work that their team is focussing on.
This allows tech leadership to track and drive improvement across the SDLC to accelerate value delivery.
Trusted by engineering leaders & teams
Phil Haslam
CTO, TalkTalk Group
“Effective technology delivery is a key strategic differentiator for our business. Plandek enables me to track and drive delivery effectiveness – putting intelligent insight in the hands of my teams and enabling me to communicate success better with my stakeholders.”
Camilo Rostoker
Director, Benevity
“Plandek is the essential tool for software teams and leaders. Overall we are loving this product and are excited to continue to ramp up our teams and get them diving deep into the Plandek data to optimize and enhance how they deliver software.”
Unlock new insights across the SDLC and beyond
Overlay engineering metrics with HR, customer and financial data for a new level of insight
Plandek custom time series API enables you to surface multiple data sources and combine them with your SDLC data.
This includes financial, HR and customer data, for example, so you can create DevFinOps metrics and much more.
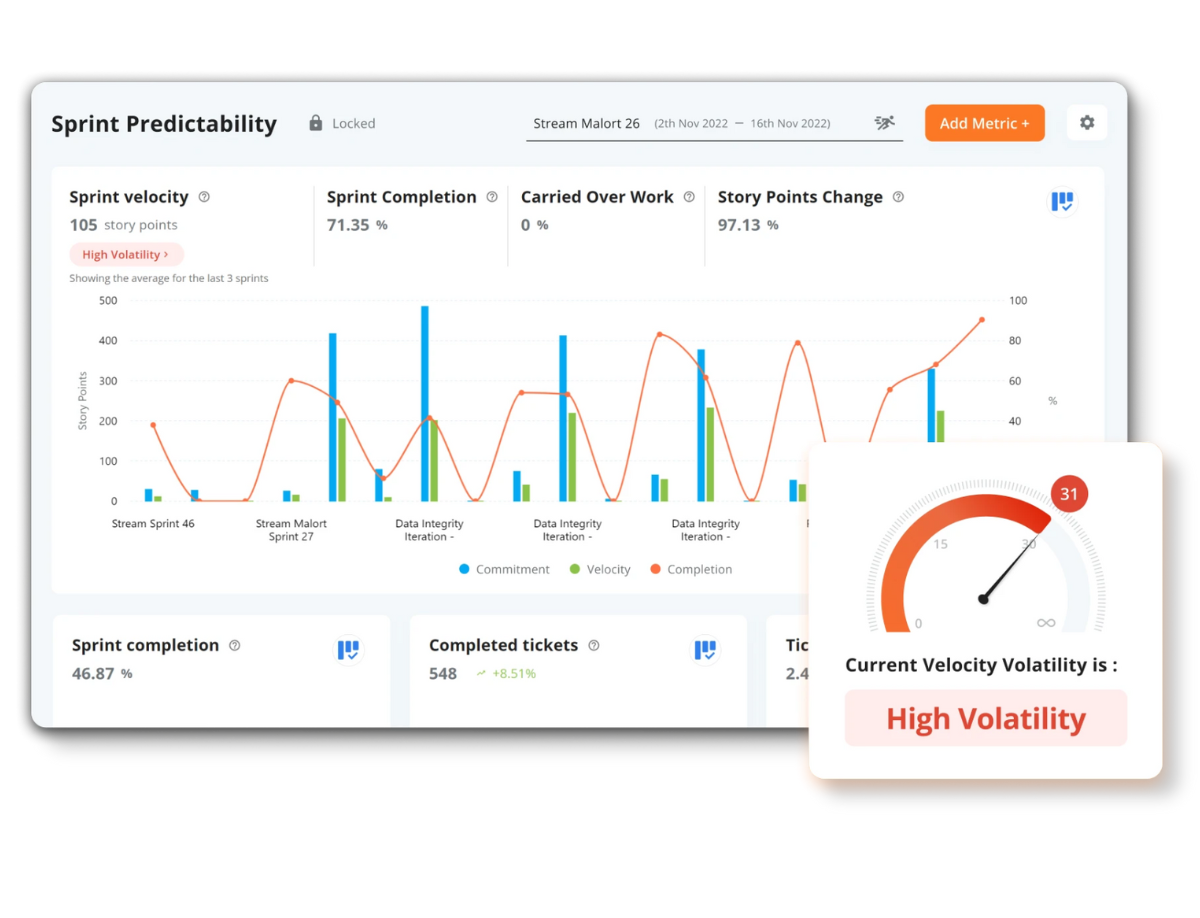
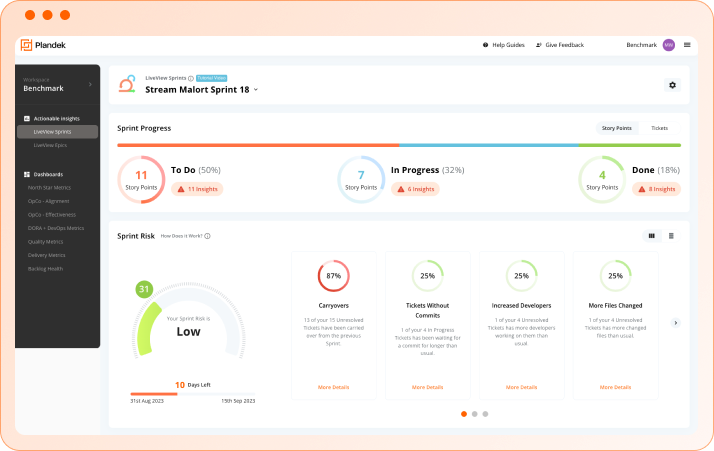
Increase velocity and predictability with SmartView's AI-powered delivery insights
Plandek SmartView analyses the complete ticket history of a team to identify anomalies that require action. Examples include stuck tickets, PR delays, QA issues and many more.
SmartView’s prescriptive analytics capability provides sprint and epic delivery risk coefficients and identifies mitigation actions for improved forecasting and on-time delivery.
ADO reporting vs Plandek comparison table
Azure DevOps
Plandek
Complete end-to-end analytics across your DevOps toolset
A 'single pane of glass' to surface all the metrics you need to accelerate value delivery - from CIO to Team Lead
Highly customisable dashboards and super-configurable metrics for every use case
Surface the widest range of delivery and engineering metrics (including the DORA and Flow metrics)
Stack-agnostic - works across Jira instances, Azure and other DevOps toolsets
Proprietary SmartView intelligent analytics to identify sprint and epic blockers in real-time and improve forecasting and on-time delivery
Ability to ingest multiple data sources (e.g. financial, HR and customer data) to create DevFinOps and other metrics
Customer success resources available to support you in the use of metrics across your organisation
Try the most configurable and flexible solution for software engineering analytics free
Book a demo with our team today
What's included in a demo:
Quick intro to Plandek from one of our experts
Explore Plandek with a product demonstration, including OTB dashboards and metrics available, custom functionality and configurations, and more
We'll share customer stories with similar use cases to show how Plandek could work for your organization
Time for a Q&A for any specific questions you may have
Next steps: free technical POC available - no payment, no commitment