
Focus engineering effort
on what matters most
Focus engineering effort on what matters most
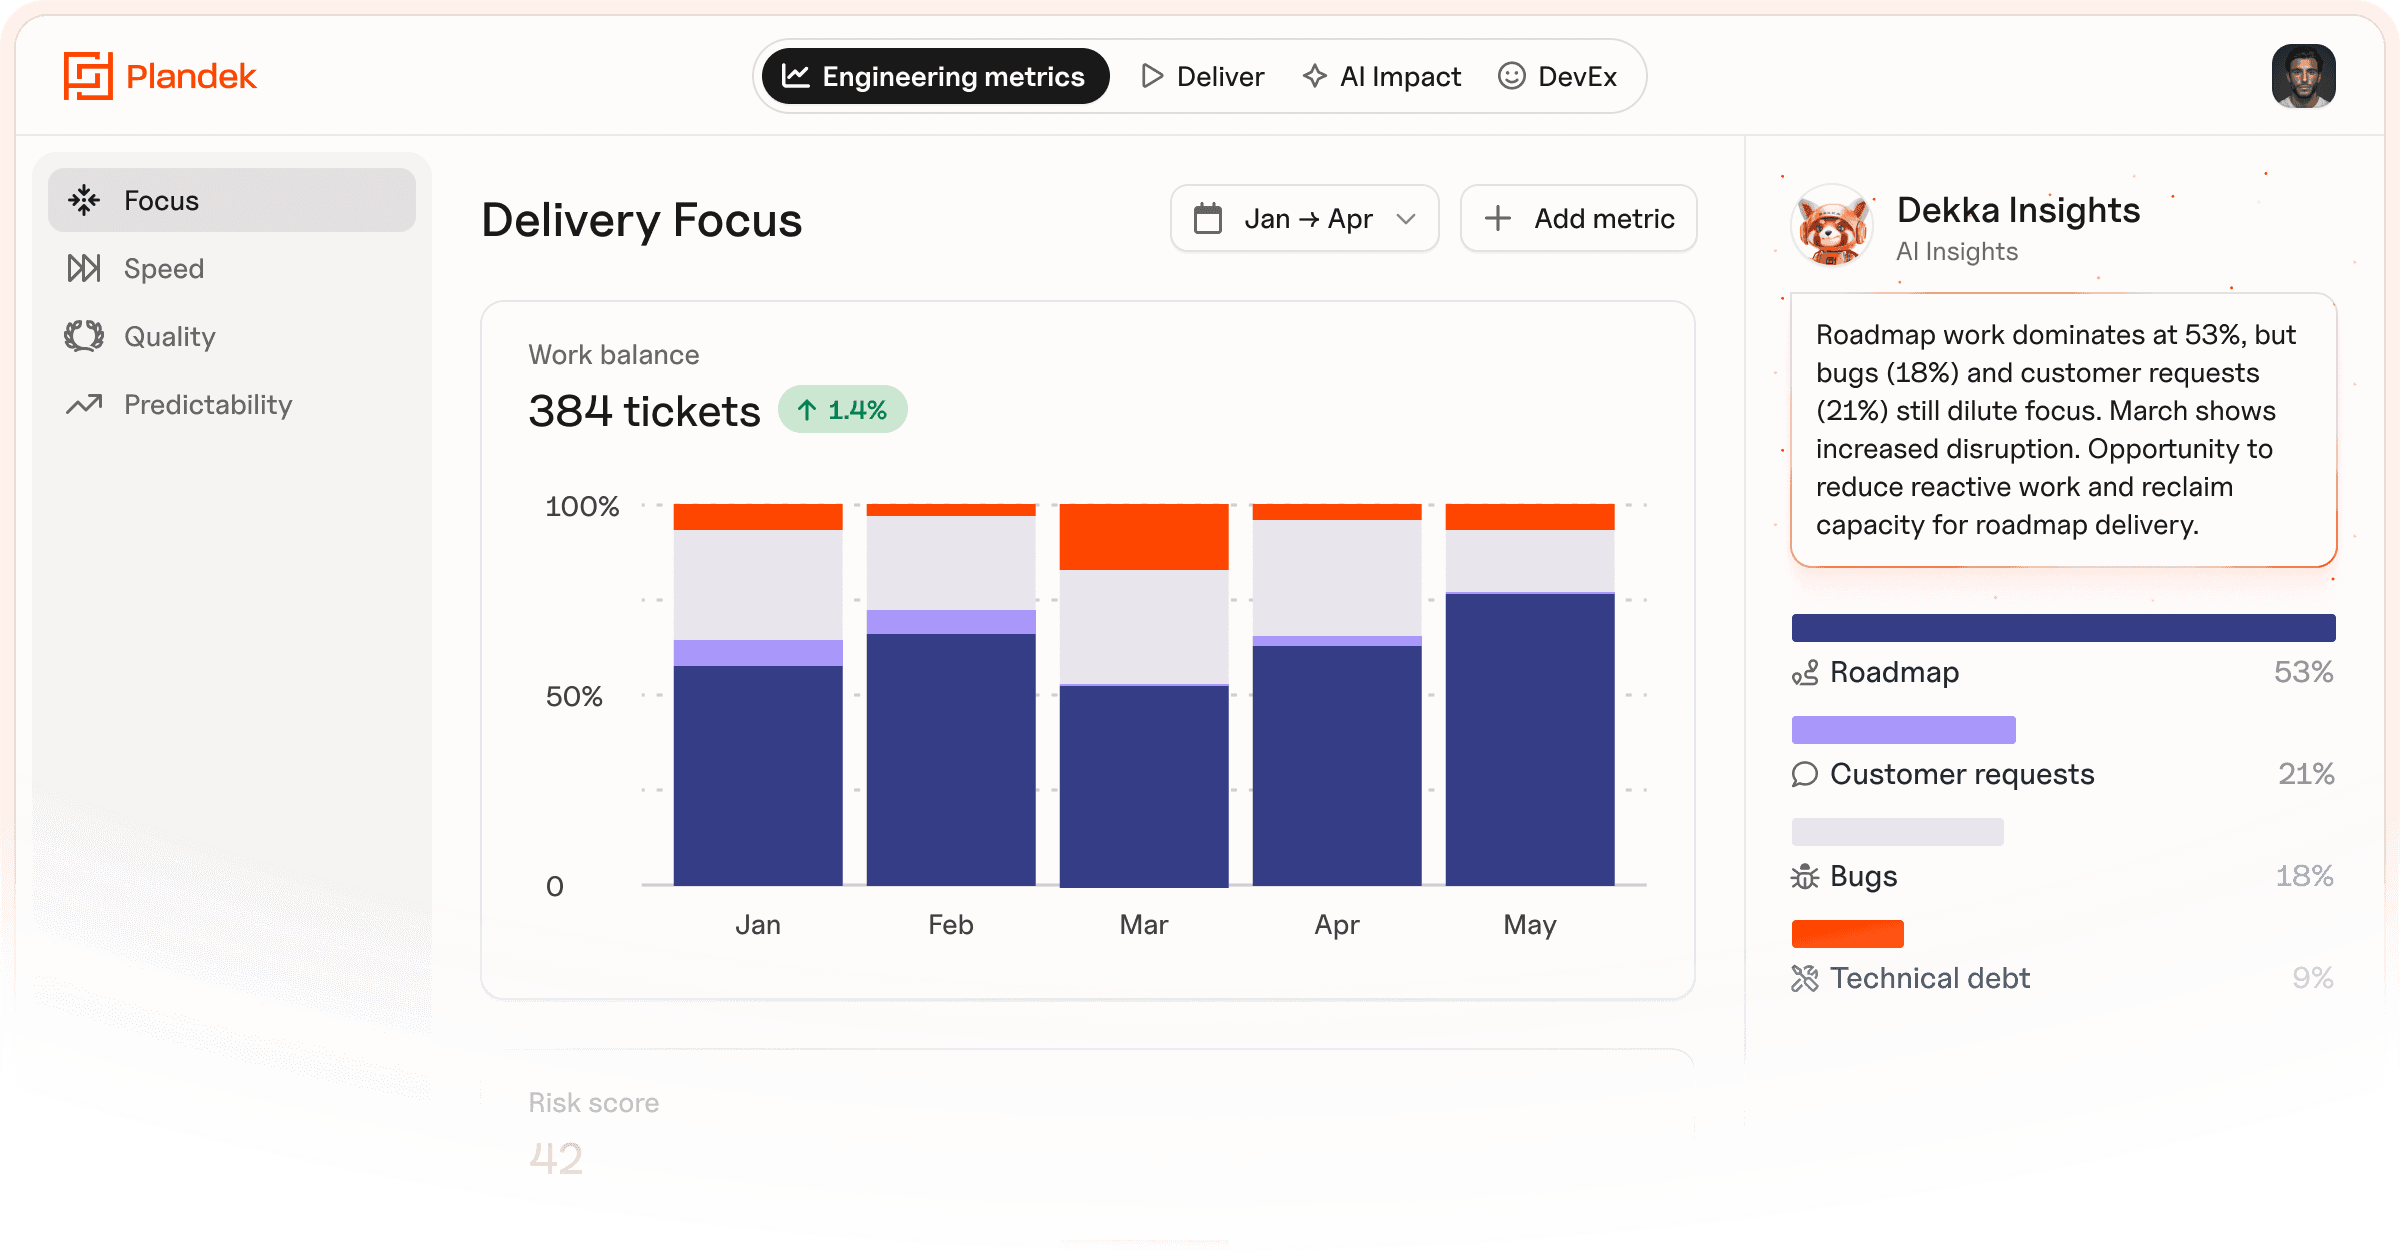
Align work to roadmap priorities and show exactly what was delivered – provide leadership with clear evidence that engineering is driving business outcomes.
Reclaim engineering capacity for meaningful work
Most engineering teams are busy, but not all of that work creates business value. By reducing unplanned work and inefficiencies, engineering leaders can reclaim capacity and redirect it toward roadmap initiatives that will have the most impact.
Most engineering teams are busy, but not all of that work creates business value. By reducing unplanned work and inefficiencies, engineering leaders can reclaim capacity and redirect it toward roadmap initiatives that will have the most impact.
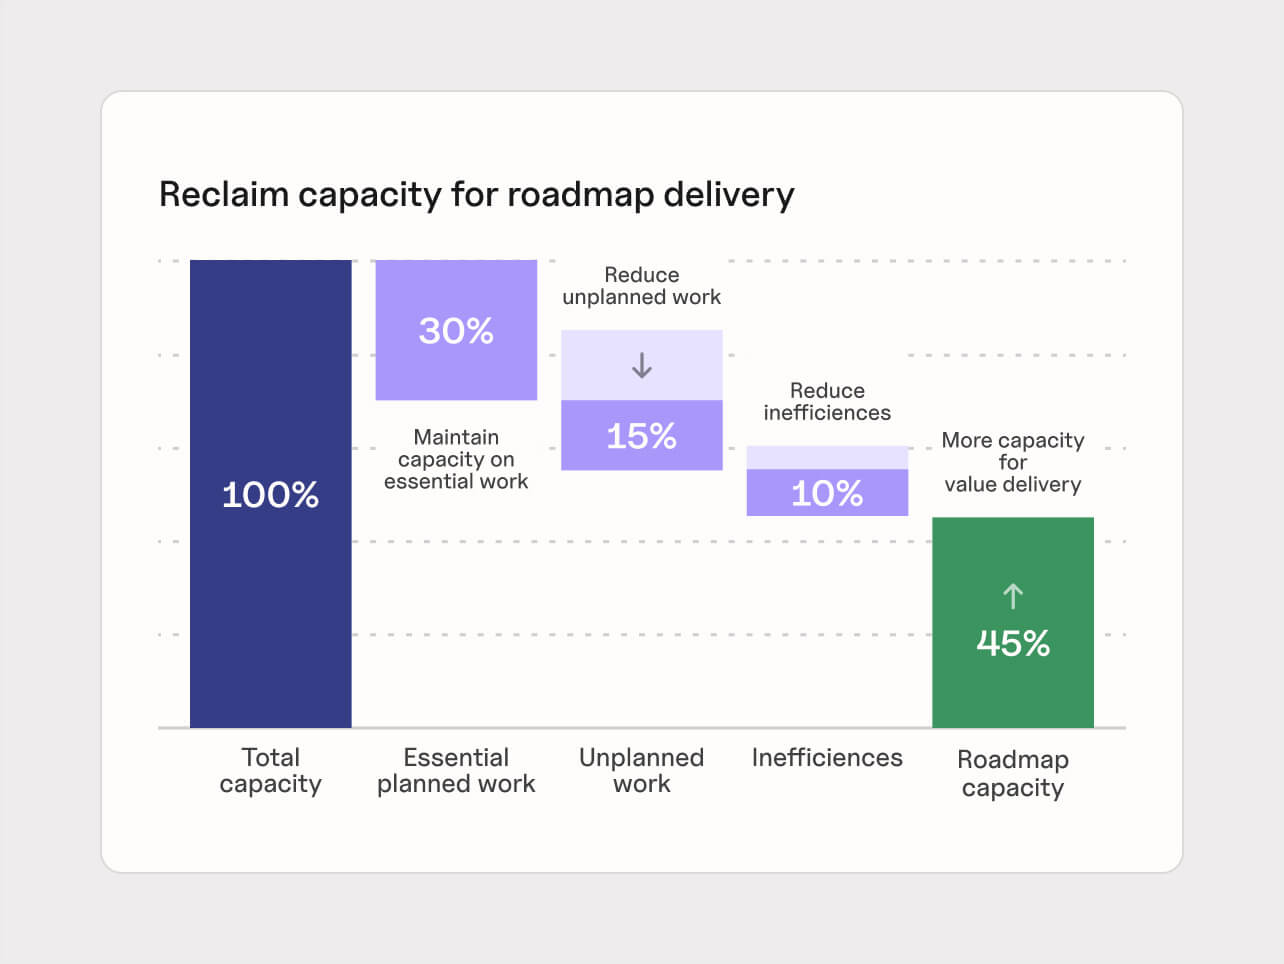
Reclaim engineering capacity for meaningful work
Most engineering teams are busy, but not all of that work creates business value. By reducing unplanned work and inefficiencies, engineering leaders can reclaim capacity and redirect it toward roadmap initiatives that will have the most impact.
See where engineering effort goes – and shift it to match your priorities
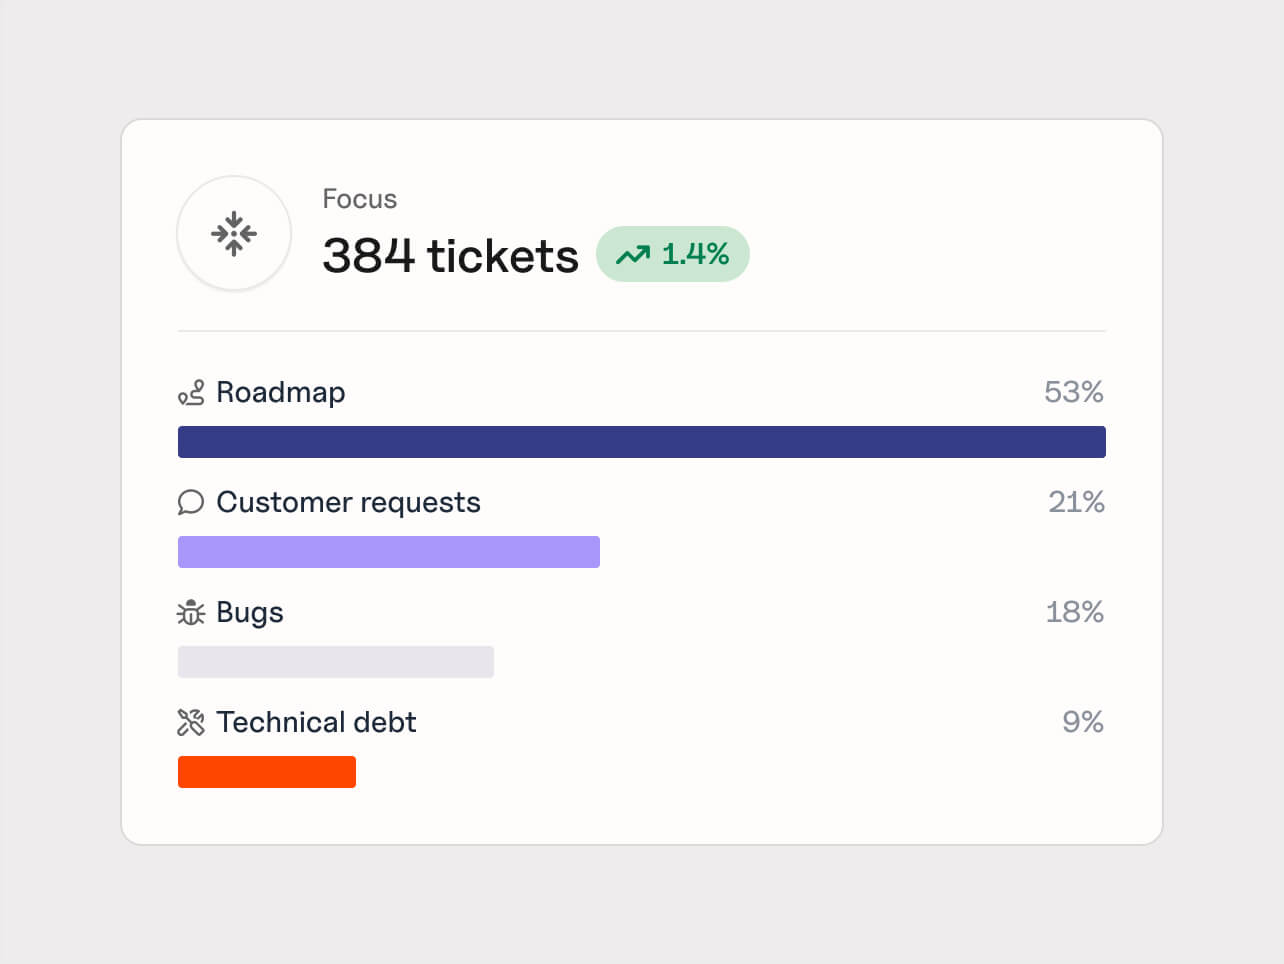
Plandek clearly tells you how engineering time is split across initiatives like roadmap, technical debt and bugs. Easily gauge where teams are focused, how that focus changes over time, and whether it actually matches your priorities.
Plandek clearly tells you how engineering time is split across initiatives like roadmap, technical debt and bugs. Easily gauge where teams are focused, how that focus changes over time, and whether it actually matches your priorities.
See where engineering effort goes – and shift it to match your priorities
Plandek clearly tells you how engineering time is split across initiatives like roadmap, technical debt and bugs. Easily gauge where teams are focused, how that focus changes over time, and whether it actually matches your priorities.
Get the insights you need instantly by connecting to the tools you already use
Plandek connects to tools like Jira, Git, and Jenkins to instantly see where engineering efforts are actually going. No manual dashboards or data stitching required – just clear, actionable insight.
Plandek connects to tools like Jira, Git, and Jenkins to instantly see where engineering efforts are actually going. No manual dashboards or data stitching required – just clear, actionable insight.

Get the insights you need instantly by connecting to the tools you already use
Plandek connects to tools like Jira, Git, and Jenkins to instantly see where engineering efforts are actually going. No manual dashboards or data stitching required – just clear, actionable insight.
Add additional data to prove engineering impact in your context
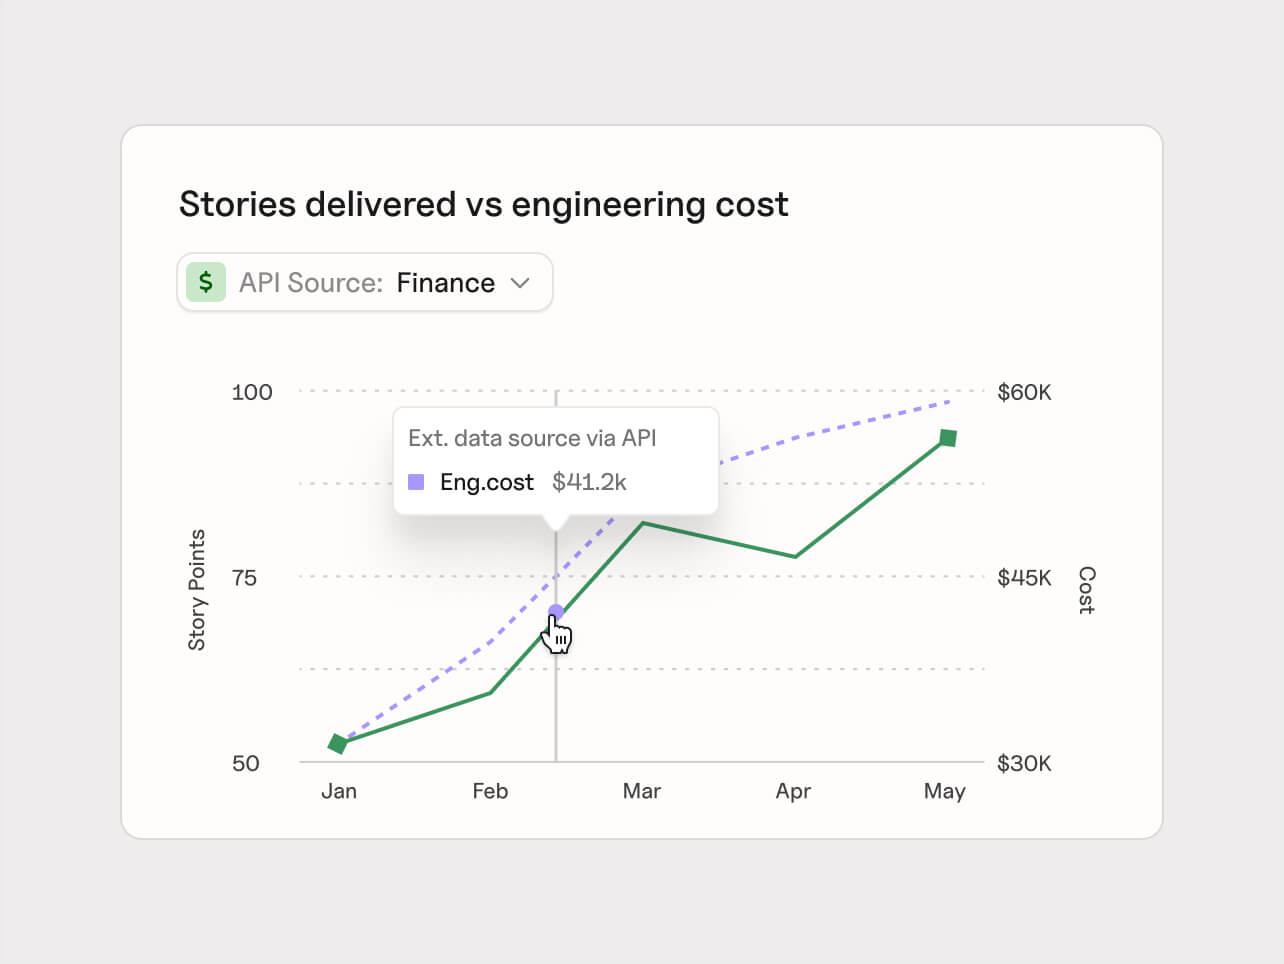
Plandek’s time series API allows you to bring external data sources like financial data together with your engineering data to see the true cost of your initiatives, inform stakeholders, and generate accurate R&D tax credit submissions.
Plandek’s time series API allows you to bring external data sources like financial data together with your engineering data to see the true cost of your initiatives, inform stakeholders, and generate accurate R&D tax credit submissions.
Add additional data to prove engineering impact in your context
Plandek’s time series API allows you to bring external data sources like financial data together with your engineering data to see the true cost of your initiatives, inform stakeholders, and generate accurate R&D tax credit submissions.

If you want to know if engineering is running efficiently, Plandek gives you the complete picture. If I could take one product with me to a new company, it would be Plandek, and I did that when I joined PEI Group.

Darren Thorpe
Chief Product Officer, PEI Group

As we accelerated with AI, we’d see productivity improve, then plateau. Plandek helped us identify the next high-value constraint so we could unlock the next stage of improvement.

Beccy Weeks
Chief AI Officer, Citation

We’ve been really able to demystify what was once previously a really complex engineering process… and really build a better conversation around what it means to build good product software.

Gary Stevens
Director of Engineering, Trainline

Predictability, while good, isn’t what we’re trying to optimise now. It is about speed to market. It will become table stakes: if you’re a technology business, you should be able to deliver software in no time at all. If you can’t, there’s a business problem looming.

James Cameron-Williams
CPTO, OAG

The data provides a mirror. It’s not just showing us where the problems are, it gives us the starting point for the conversations we need to have with our teams.

Niklas Lundborg
CTO, Bokio

Plandek provides industry experts who tailor to our needs… Plandek are leaders in this space so we need to tap into this experience.

Daniel Pierce
Sr Director of Data & Analytics, Sage
If you want to know if engineering is running efficiently, Plandek gives you the complete picture. If I could take one product with me to a new company, it would be Plandek, and I did that when I joined PEI Group.
Darren Thorpe
Chief Product Officer, PEI Group
As we accelerated with AI, we’d see productivity improve, then plateau. Plandek helped us identify the next high-value constraint so we could unlock the next stage of improvement.
Beccy Weeks
Chief AI Officer, Citation
We’ve been really able to demystify what was once previously a really complex engineering process… and really build a better conversation around what it means to build good product software.
Gary Stevens
Director of Engineering, Trainline
Predictability, while good, isn’t what we’re trying to optimise now. It is about speed to market. It will become table stakes: if you’re a technology business, you should be able to deliver software in no time at all. If you can’t, there’s a business problem looming.
James Cameron-Williams
CPTO, OAG
The data provides a mirror. It’s not just showing us where the problems are, it gives us the starting point for the conversations we need to have with our teams.
Niklas Lundborg
CTO, Bokio
Plandek provides industry experts who tailor to our needs… Plandek are leaders in this space so we need to tap into this experience.
Daniel Pierce
Sr Director of Data & Analytics, Sage
If you want to know if engineering is running efficiently, Plandek gives you the complete picture. If I could take one product with me to a new company, it would be Plandek, and I did that when I joined PEI Group.
Darren Thorpe
Chief Product Officer, PEI Group
As we accelerated with AI, we’d see productivity improve, then plateau. Plandek helped us identify the next high-value constraint so we could unlock the next stage of improvement.
Beccy Weeks
Chief AI Officer, Citation
We’ve been really able to demystify what was once previously a really complex engineering process… and really build a better conversation around what it means to build good product software.
Gary Stevens
Director of Engineering, Trainline
Predictability, while good, isn’t what we’re trying to optimise now. It is about speed to market. It will become table stakes: if you’re a technology business, you should be able to deliver software in no time at all. If you can’t, there’s a business problem looming.
James Cameron-Williams
CPTO, OAG
The data provides a mirror. It’s not just showing us where the problems are, it gives us the starting point for the conversations we need to have with our teams.
Niklas Lundborg
CTO, Bokio
Plandek provides industry experts who tailor to our needs… Plandek are leaders in this space so we need to tap into this experience.
Daniel Pierce
Sr Director of Data & Analytics, Sage
Speak to a delivery expert today
Understand where time is spent, how it maps to company goals, and prove the return on engineering investment with clear, data-backed insights.











Platform
Platform
Contact us
UK Office
Unit 313 The Print Rooms, 164-180
Union St, London SE1 0LH
US Office
Floor 4, 1515 Mockingbird Ln,
Charlotte, NC 28209, USA