


The dashboards look great. Sprint velocity is at an all-time high, cycle time is trending down, and PRs are closing faster than ever.
And yet, something feels off. Production incidents haven’t declined, releases still slip, and your best engineers seem just as overloaded as before.
You’re not imagining things. This is the measurement crisis of AI-augmented engineering. The frameworks built to track human developer productivity don’t map cleanly onto workflows where AI handles first drafts, developers become editors and reviewers, and the nature of “done” shifts from task to task.
A sprint that closes twice as many tickets might represent less real progress if AI handled the trivial ones while thorny problems sat untouched. Faster code generation means nothing if it’s followed by longer review cycles and more rework.
If you want an accurate read on how your AI-augmented team is performing in 2026, you need to measure different things. We’ll walk through what that looks like.
Why Engineering Measurement Has to Change in 2026
How developers spend their time looks completely different from how it did two years ago. The role hasn’t officially changed, but the day-to-day work inside it has.
Before AI tools, a developer might spend hours writing a feature from scratch. Now, they spend minutes generating a first draft and hours reviewing, testing, and fixing it.
According to Atlassian’s 2025 State of DevEx Survey, developers only spend about 16% of their time actually writing code. The rest goes to reviews, meetings, debugging, and documentation.
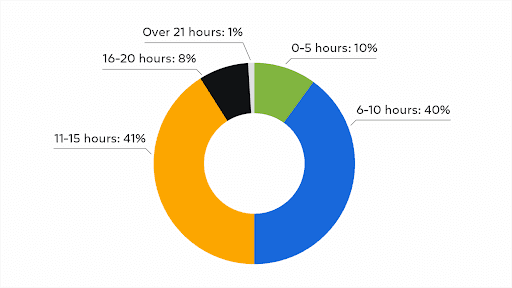
(Source: Atlassian)
The problem is that traditional metrics were built around a different workflow. They assume:
More code written = more progress made
Faster task completion = higher productivity
Shorter cycle times = better team performance
However, these assumptions fall apart when AI handles the straightforward work, and humans handle the complex parts. A METR study from mid-2025 found that developers expected AI tools to reduce task completion time by 24%.
But in practice, those same tasks took 19% longer when AI was involved. That extra time went straight into reviewing and fixing AI-generated code.
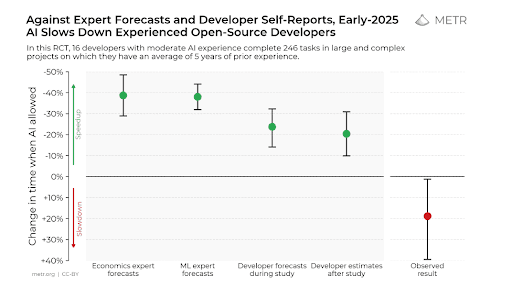
(Source: METR)
The skills that drive value have also changed. Prompt quality, reviewing AI output carefully, and knowing when not to use AI are things that don’t show up in your sprint metrics.
Your best engineers might even look less productive on paper precisely because they’re the ones catching problems that others miss. If your metrics don’t reflect this change, they’re tracking a version of engineering work that’s already out of date.
The 4 Metric Categories Engineering Leaders Need in 2026
There’s no single metric that captures AI-augmented engineering performance end-to-end. You need a few different categories working together to get the full picture:
Adoption and Usage Metrics
Why this category matters now: Most organizations have surprisingly little visibility into how AI tools are actually being used. Adoption metrics tell you whether developers are using AI at all, how often, and in what contexts.
What metrics to track:
Tool activation rate: The percentage of developers who have AI tools installed and enabled. A low number here might mean that there are access issues, onboarding gaps, or a lack of awareness.
Daily/weekly active usage: How many developers use AI tools regularly versus occasionally. High activation but low regular usage often points to friction or underwhelming results.
Usage by task type: What developers use AI for matters as much as whether they use it at all. Code generation, test writing, documentation, and code review have different impact profiles.
Prompt volume and frequency: How often developers interact with AI tools throughout their day. Helps distinguish between light experimentation and genuine integration into workflows.
Opt-out and disable rates: How often developers turn AI features off, either temporarily or permanently. A rising opt-out rate is an early warning sign worth investigating.
Common pitfalls to avoid: High adoption numbers are easy to celebrate, but don’t mean much on their own. A team with 100% tool activation and zero perceived value isn’t a win.
Engineering leaders should connect adoption metrics to experience and outcomes before drawing any conclusions. Without experience and outcome data, you’ll miss warning signs. One Reddit user shared a common example:
Delivery and Quality Metrics
Why this category matters now: Delivery speed and code quality have always mattered, but AI has complicated the relationship between them. Teams can ship faster and break more things, or slow down on paper while producing better outcomes. You need metrics that see both sides of that equation.
What metrics to track:
Cycle time (with context): How long it takes from commit to production. Still useful, but now you need to understand what’s happening inside that window since faster generation might be offset by slower review.
Defect introduction rate: How often new code brings bugs, and whether AI-assisted code behaves differently from human-written code. You should track this at the PR level to spot patterns early.
Rework rate: How often merged code needs to be revised or rolled back shortly after release. A spike here can mean that AI-generated code is passing review but failing in production.
Code review time: How long PRs spend in review before approval. If this number is climbing while generation time drops, your developers are absorbing the cost of AI output somewhere.
Production incident rate: The bottom line on quality. Track whether faster delivery has come at the cost of stability, or whether incident rates have held steady as AI tools rolled out.
Common pitfalls to avoid: Speed metrics are seductive because they’re easy to measure and easy to improve (at least on paper). But faster delivery combined with rising defect rates is a step backward. Make sure quality indicators are also part of every delivery conversation.
Developer Experience Metrics
Why this category matters now: AI tools promise to make developers more productive, but productivity gains mean little if your team is burned out or frustrated. Developer experience metrics keep you honest about whether AI is helping your team or quietly making things harder.
What metrics to track:
Tool satisfaction scores: How useful developers find their AI tools in practice. Low satisfaction alongside high adoption tells you something is broken. Survey this regularly and segment by role and team.
Cognitive load indicators: How mentally taxed developers feel at the end of the day. AI can reduce effort on some tasks, but bring strain elsewhere — more context switching, more review burden, more second-guessing outputs.
Time lost to friction: Hours spent on blockers, unclear requirements, waiting on reviews, and other inefficiencies. Atlassian’s 2025 data showed AI saved time on tasks, but friction elsewhere ate those gains. Track both sides.
Focus time: How much uninterrupted time developers get for deep work. AI tools can fragment attention when developers constantly bounce between generating, reviewing, and fixing.
Retention and attrition signals: Whether developers are staying, leaving, or checking out. Experience issues show up here eventually. Exit interviews and engagement surveys can catch AI-related frustrations early.
Common pitfalls to avoid: Because experience is subjective, it’s tempting to wave it off. That’s a mistake. Problems here tend to predict delivery and retention issues down the road. Take the feedback seriously, even when it’s uncomfortable.
Business Impact Metrics
Why this category matters now: The honeymoon period for AI adoption is over. Leadership wants to know whether the investment is paying off. Business impact metrics give you that answer by connecting engineering activity to outcomes the broader organization cares about.
What metrics to track:
Time to market: How long it takes to go from idea to shipped feature. AI should theoretically compress this, but only if the time saved in generation isn’t lost elsewhere. Track the full timeline, not just the coding portion.
Cost per feature or release: What it costs to deliver work, including tooling, infrastructure, and developer time. Compare this before and after AI adoption to see whether you’re getting more output for the same investment.
ROI on AI tooling: The return on what you’re spending on AI tools, licenses, and infrastructure. This means tracking costs against measurable productivity or quality gains. Don’t assume value because adoption is high.
Opportunity cost reduction: How much faster you can respond to market needs or customer requests. AI should help teams move more quickly on high-priority work.
Developer time reallocation: What happens to the time AI saves. Freed-up hours only create business value if they go toward higher-impact work. Track whether developers are tackling more strategic projects or just filling the gap with more tasks.
Common pitfalls to avoid: These metrics are harder to pin down and easier to manipulate than activity-based ones. Don’t claim ROI you can’t back up, and avoid leaning on cherry-picked success stories.
Metrics That Became Actively Misleading in AI-Assisted Teams
There’s a difference between a metric that’s limited and one that’s pointing you in the wrong direction. Some of the numbers engineering teams have tracked for years now fall into the second category, and they’re actively creating false confidence.
Here are the metrics most likely to mislead in AI-augmented environments:
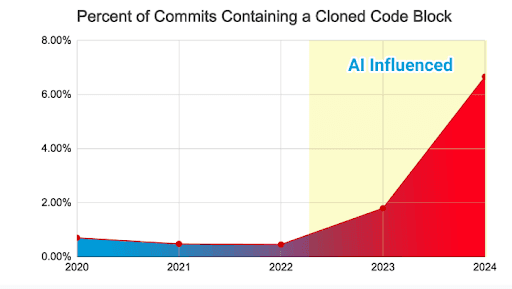
Lines of code: Always a flawed metric, but AI has made it meaningless. A developer can generate hundreds of lines in minutes. GitClear’s analysis of 211 million changed lines found that AI-assisted coding is linked to 4x more code duplication than before.
Velocity and story points: These metrics assume a stable relationship between effort and output. AI breaks that assumption. A sprint that closes twice as many tickets might just mean AI handled the easy ones while complex work sat in the backlog.
Cycle time: Faster cycle times look great on a dashboard, but they can hide what’s happening inside that window. If code generation takes five minutes and review takes five hours, your cycle time might improve while the actual developer burden increases.
PR merge rate: More PRs merged faster sounds like a win. But if those PRs need more review cycles, more post-merge fixes, or more rework, you haven’t gained anything. The 2024 DORA report found that every 25% increase in AI adoption correlated with a 7.2% drop in system stability.
Commit frequency: AI makes it easy to commit more often, but that doesn’t mean more progress is being made. Instead, it might just mean developers are pushing smaller, AI-generated chunks that need cleanup later.
None of this means you should stop tracking these numbers entirely. But you need to stop treating them as proof of progress. They need other data next to them before they’re useful.
What “Good” Looks Like in AI-Augmented Engineering
There’s no universal benchmark for AI-augmented engineering performance. What “good” looks like depends on your team, your tools, and how far along you are in adoption. That said, some patterns hold true across the board.
The key is balance across categories. Strong numbers in one area don’t mean much if another area is suffering. Here’s what healthy performance looks like when the pieces fit together:
Category | What good looks like |
Adoption & Usage | Tools are widely used and widely liked. Developers reach for AI because it helps, not because it’s mandated. |
Delivery & Quality | Faster shipping without more fires to put out. Defect rates and incident counts stay flat or trend down alongside speed gains. |
Developer Experience | Developers say AI makes their work easier, not more complicated. They have time for deep focus and don’t feel more stretched than before. |
Business Impact | Time to market improves on high-priority work. Leadership can see a clear connection between AI investment and outcomes. |
You’re looking for reinforcement, not trade-offs. When adoption, delivery, experience, and business impact all trend in the right direction, you’re getting value from AI. When one improves while another declines, you’re probably just moving the problems around.
This is why looking at categories in isolation is risky. A team can hit great adoption numbers while quietly burning out. The only way to know if AI is working is to check that the wins in one area aren’t coming at the expense of another.
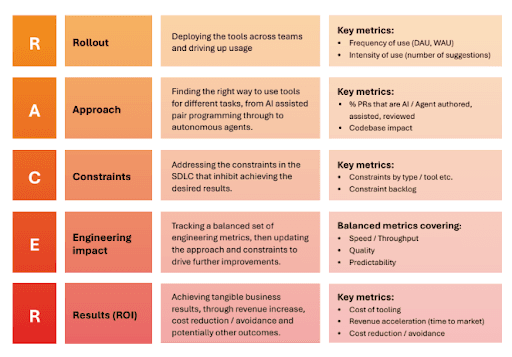
PRO TIP: If you want a structured way to connect adoption to ROI, look at Plandek’s RACER framework (Rollout → Approach → Constraints → Engineering Impact → Results). The big insight is that most teams stall out because they track adoption numbers without handling the bottlenecks AI exposes downstream. High usage means nothing if code reviews, requirements, or deployments are still choking the pipeline.
Get the Full Picture of AI-Augmented Performance with Plandek
To get a clear read on AI-augmented performance, you’ll need more than just bolt a few new reports onto your existing stack. You need a way to see the full picture (adoption, delivery, experience, and outcomes) in one place, updated in real time.
Plandek is built for exactly this. It’s a software engineering intelligence platform that connects to the tools you already use — Jira, GitHub, GitLab, Azure DevOps — and gives you a single view across your entire delivery lifecycle.
Here are just some of the key features you’ll get with Plandek:
GenAI impact tracking: Plandek tracks adoption and usage of tools like Copilot, Cursor, and Devin across your org. You can measure how AI affects velocity, quality, predictability, and ROI at the team level.
50+ configurable metrics: Choose from DORA, Flow, SPACE, and Plandek’s Four Pillars framework, or even build your own custom metrics. Every metric is filterable and adjustable to match how your teams truly work.
North Star dashboards: Define what “good” looks like for your organization and track progress over time. Share clear, understandable KPIs with leadership and stakeholders without translating from engineering-speak.
Dekka AI assistant: Plandek’s built-in AI interprets your data and points to risks, blockers, and action items. You can also get insights pushed to Slack or email so your team can act on them in real time.
Business alignment tools: Connect engineering metrics to outcomes that the rest of the organization cares about. Engineering leaders can combine delivery data with finance, HR, or customer data to show ROI and strategic impact.
Custom dashboards at every level: You can build views for individual teams, managers, or executives. Aggregate data across your org structure and give each persona the insights relevant to them.
AI has completely changed how engineering teams work. And your measurement approach should change with it.
If you’re ready to move past outdated metrics and get a clear view of AI-augmented performance, book a demo with Plandek.
Written by
Charlie Ponsonby
Co-founder & CEO
Charlie Ponsonby is CEO and Co-founder of Plandek, the leading Developer Productivity Insight (DPI) platform that helps software engineering teams drive productivity and transition to AI-led engineering. He writes widely on the opportunities and challenges inherent in the transition to the agentic SDLC. Prior to founding Plandek, Charlie founded Simplydigital, which grew to become the UK's largest broadband and digital services comparison business before being acquired by Europe's largest consumer electronics retailer. He started his career at Accenture and has held senior leadership roles in retail and telco. Charlie holds a degree from the University of Cambridge.


See how your engineering efforts translate into measurable business impact
Measure delivery performance, AI impact, and engineering productivity with hundreds of metrics, OOTB dashboards and custom configurations.


Contact us
UK Office
Unit 313 The Print Rooms, 164-180
Union St, London SE1 0LH
US Office
Floor 4, 1515 Mockingbird Ln,
Charlotte, NC 28209, USA