
Improve software delivery with Plandek's Software Engineering Intelligence Platform
Improve software delivery with Plandek's Software Engineering Intelligence Platform
Improve software delivery with Plandek's Software Engineering Intelligence Platform
Gain real-time software engineering insights with the leading software intelligence platform.
Staying on top of critical software delivery metrics like cycle time, lead time, and deployment frequency can be tough. Plandek simplifies the process by providing real-time visibility into your entire software delivery pipeline. Our Software Engineering Intelligence platform enables teams to track, measure, and optimize software delivery metrics, helping you consistently deliver high-quality software on time.
Book your free Plandek demo to get a guided tour of our market leading SEI platform. Our expert consultant will tailor the demonstration to your needs and answer all of your questions.









Deliver faster & smarter with software engineering analytics
Up to 55%
Reduction of Time to Value
Deliver faster & smarter with software engineering analytics
Up to 55%
Reduction of Time to Value
Deliver faster & smarter with software engineering analytics
Up to 55%
Reduction of Time to Value
0
0
0
0
%
%
%
Increase of Deployment Frequency
0
0
0
0
%
%
%
Reduction of Escaped Defects
0
0
0
0
%
%
%
Increase of Sprint Accuracy
0
0
0
0
%
%
%
Increase ofFlow Efficiency
Why Choose Plandek for Software Engineering Intelligence?
All of your software engineering data in one trusted platform
Comprehensive Metrics
Gain access to a range of software delivery metrics including lead time, cycle time, and deployment frequency.
Real-Time Dashboards
Track and visualize software delivery performance with customizable dashboards.
Team Collaboration
Empower your software engineering teams to make data-driven decisions with a powerful SEI platform.
Increased Productivity
Achieve faster time-to-market with actionable insights into every stage of software delivery.
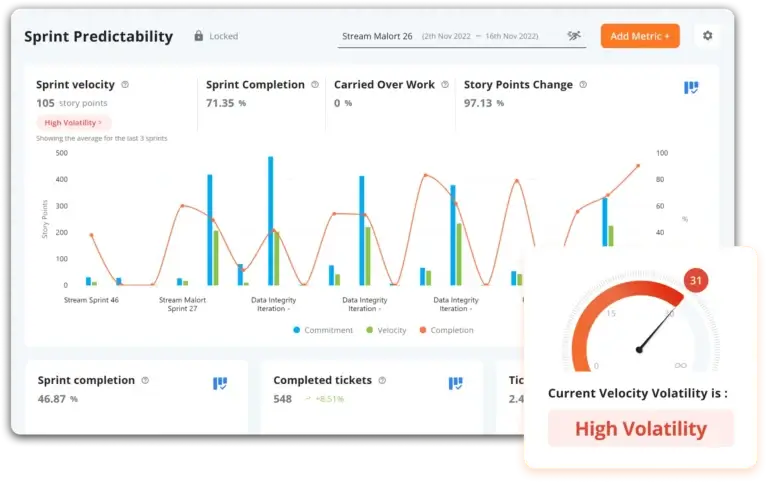
How Plandek's software intelligence platform works
How Plandek's software intelligence platform works
1
1
Connect Your Delivery Tools
Seamlessly integrate with Jira, Git, Jenkins, and other popular DevOps tools.
2
2
Track Software Delivery KPIs
Instantly track key software delivery KPIs across your development teams.
3
3
Optimize Delivery Performance
Use data-driven insights to optimize and improve every phase of the software delivery process.
Empower Your Engineering
Teams with Plandek
Empower Your Engineering
Teams with Plandek
Use the DORA or Flow metrics – or select your own
Use the DORA or Flow metrics - or select your own
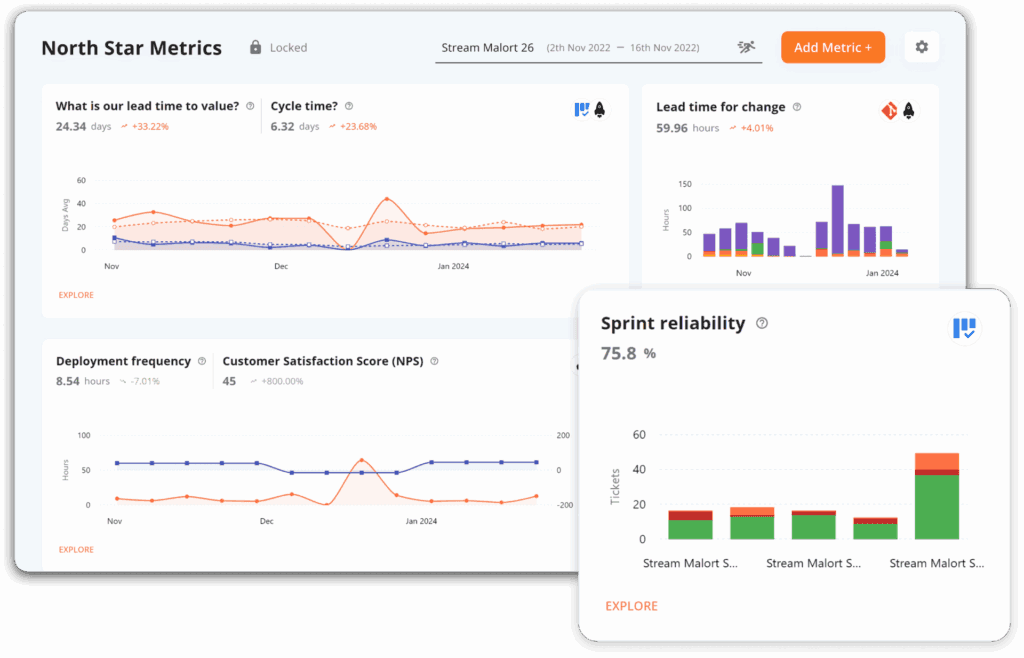
Plandek offers a fully customizable metrics dashboard that tracks the most important software delivery KPIs, including:
Cycle Time: Measure how long it takes from the start of development to code deployment, allowing you to identify and eliminate bottlenecks.
Lead Time: Track the time it takes from feature request to deployment, giving you insights into how efficiently your teams are responding to business needs.
Deployment Frequency: Monitor how often your team is shipping updates, helping you gauge productivity and agility.
These dashboards are automatically updated in real-time, ensuring that you have the latest information at your fingertips.
Plandek offers a fully customizable metrics dashboard that tracks the most important software delivery KPIs, including:
Cycle Time: Measure how long it takes from the start of development to code deployment, allowing you to identify and eliminate bottlenecks.
Lead Time: Track the time it takes from feature request to deployment, giving you insights into how efficiently your teams are responding to business needs.
Deployment Frequency: Monitor how often your team is shipping updates, helping you gauge productivity and agility.
These dashboards are automatically updated in real-time, ensuring that you have the latest information at your fingertips.
Use the DORA or Flow metrics – or select your own
Plandek offers a fully customizable metrics dashboard that tracks the most important software delivery KPIs, including:
Cycle Time: Measure how long it takes from the start of development to code deployment, allowing you to identify and eliminate bottlenecks.
Lead Time: Track the time it takes from feature request to deployment, giving you insights into how efficiently your teams are responding to business needs.
Deployment Frequency: Monitor how often your team is shipping updates, helping you gauge productivity and agility.
These dashboards are automatically updated in real-time, ensuring that you have the latest information at your fingertips.
Integration with the tools you already use
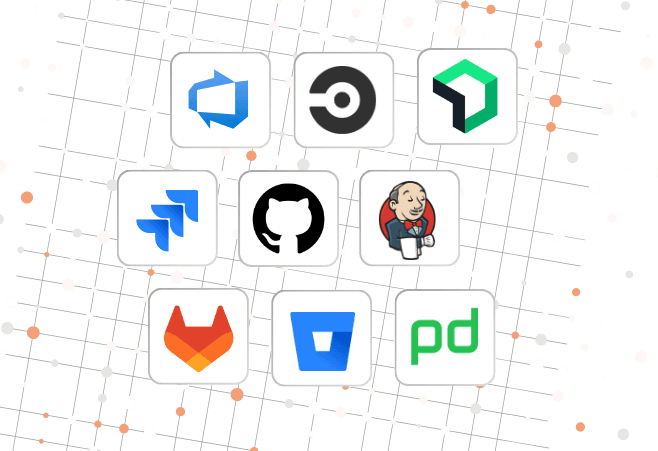
Plandek seamlessly integrates with your existing toolset, including Jira, GitHub, GitLab, Jenkins, Bitbucket, and other CI/CD tools. No need to switch between platforms – Plandek pulls data from these sources, giving you a single point of reference for all your delivery metrics.
Plandek seamlessly integrates with your existing toolset, including Jira, GitHub, GitLab, Jenkins, Bitbucket, and other CI/CD tools. No need to switch between platforms – Plandek pulls data from these sources, giving you a single point of reference for all your delivery metrics.
Integration with the tools you already use
Plandek seamlessly integrates with your existing toolset, including Jira, GitHub, GitLab, Jenkins, Bitbucket, and other CI/CD tools. No need to switch between platforms – Plandek pulls data from these sources, giving you a single point of reference for all your delivery metrics.
Team-level insights for better collaboration
With Plandek, you can break down metrics by team, project, or even individual contributors. This gives managers the ability to:
Spot High Performers: Identify which teams are excelling and which ones might need support.
Balance Workloads: Ensure that no team is overloaded by visualizing team-level metrics.
Promote Accountability: Teams can track their own progress and improve their delivery speed and quality.
After setting up your teams in Plandek, you can generate detailed reports that highlight each team’s progress, helping everyone stay aligned on goals.
With Plandek, you can break down metrics by team, project, or even individual contributors. This gives managers the ability to:
Spot High Performers: Identify which teams are excelling and which ones might need support.
Balance Workloads: Ensure that no team is overloaded by visualizing team-level metrics.
Promote Accountability: Teams can track their own progress and improve their delivery speed and quality.
After setting up your teams in Plandek, you can generate detailed reports that highlight each team’s progress, helping everyone stay aligned on goals.
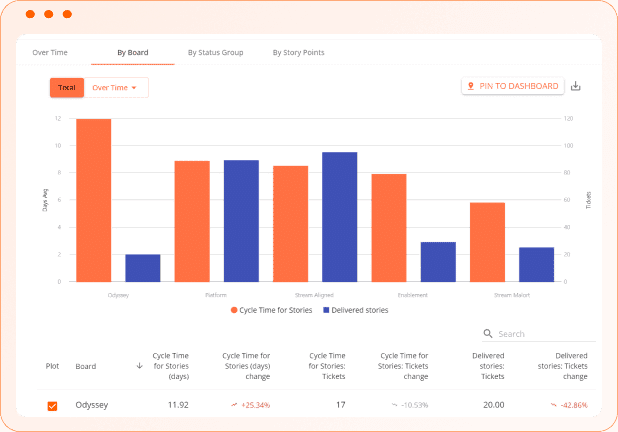
Team-level insights for better collaboration
With Plandek, you can break down metrics by team, project, or even individual contributors. This gives managers the ability to:
Spot High Performers: Identify which teams are excelling and which ones might need support.
Balance Workloads: Ensure that no team is overloaded by visualizing team-level metrics.
Promote Accountability: Teams can track their own progress and improve their delivery speed and quality.
After setting up your teams in Plandek, you can generate detailed reports that highlight each team’s progress, helping everyone stay aligned on goals.
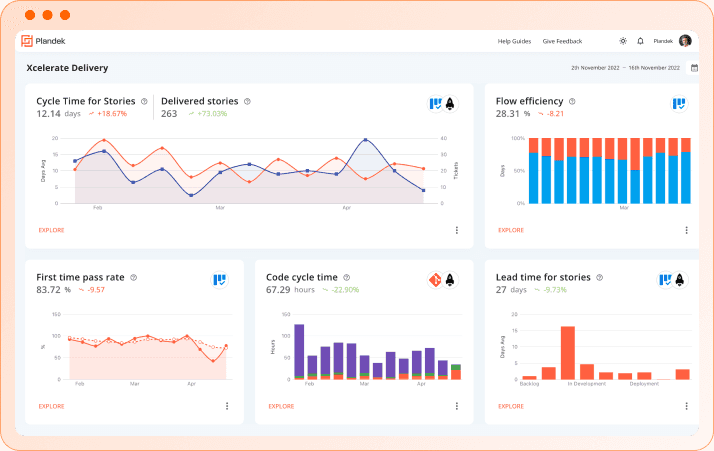
Advanced analytics and trend analysis
Plandek’s analytics capabilities allow you to dig deep into historical data and spot trends over time. You can:
Identify Bottlenecks: Use data to pinpoint recurring blockers in your workflow.
Understand Trends: See how your software delivery metrics are improving or declining over time.
Predict Future Performance: Use trend data to make informed decisions about future releases and capacity planning.
Plandek’s advanced analytics are built into the dashboard – simply select the metrics you want to analyze over time, and view trends to inform your strategy.
Plandek’s analytics capabilities allow you to dig deep into historical data and spot trends over time. You can:
Identify Bottlenecks: Use data to pinpoint recurring blockers in your workflow.
Understand Trends: See how your software delivery metrics are improving or declining over time.
Predict Future Performance: Use trend data to make informed decisions about future releases and capacity planning.
Plandek’s advanced analytics are built into the dashboard – simply select the metrics you want to analyze over time, and view trends to inform your strategy.
Advanced analytics and trend analysis
Plandek’s analytics capabilities allow you to dig deep into historical data and spot trends over time. You can:
Identify Bottlenecks: Use data to pinpoint recurring blockers in your workflow.
Understand Trends: See how your software delivery metrics are improving or declining over time.
Predict Future Performance: Use trend data to make informed decisions about future releases and capacity planning.
Plandek’s advanced analytics are built into the dashboard – simply select the metrics you want to analyze over time, and view trends to inform your strategy.
Value Stream Mapping for end-to-end visibility
Plandek’s value stream mapping provides a holistic view of your entire software delivery process, from concept to production. By mapping out each step, you can identify where delays or inefficiencies occur and make data-driven improvements.
Map out your software delivery pipeline, connect your delivery tools, and track how work moves through each stage of the SDLC.
Plandek’s value stream mapping provides a holistic view of your entire software delivery process, from concept to production. By mapping out each step, you can identify where delays or inefficiencies occur and make data-driven improvements.
Map out your software delivery pipeline, connect your delivery tools, and track how work moves through each stage of the SDLC.
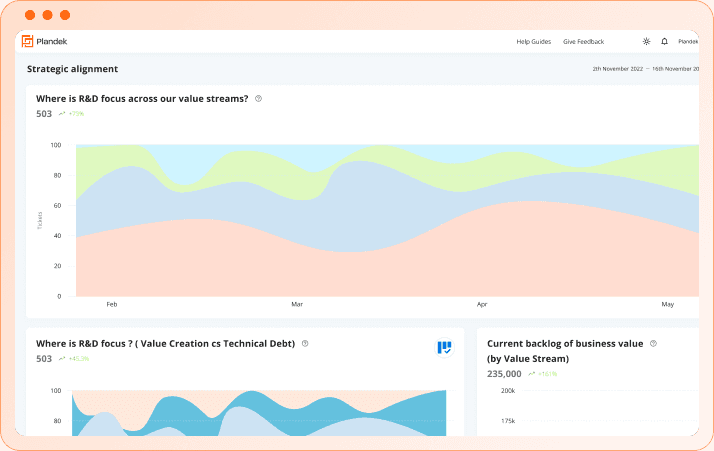
Value Stream Mapping for end-to-end visibility
Plandek’s value stream mapping provides a holistic view of your entire software delivery process, from concept to production. By mapping out each step, you can identify where delays or inefficiencies occur and make data-driven improvements.
Map out your software delivery pipeline, connect your delivery tools, and track how work moves through each stage of the SDLC.
Plandek empowers innovative CTOs
and engineering leaders globally
Plandek empowers innovative CTOs
and engineering leaders globally
























Neil Sayer
Head of Technology, PEI
“We want to measure, so we have made Plandek our new norm for every team. It consistently provides us with high quality, up-to-date transparency into our processes.”
5/5

Andrew Mulford
VP Head of Delivery, Preqin
"The Plandek team supported us when we needed to make customization and changes. It's a very quick and simple tool to use. We can create custom dashboards, which focus on specific teams, but it also enables us to scale."
5/5

Jayr Motta
Head of Engineering
"After almost 2 years with Plandek, the conversation has shifted a lot among the leaders and many team members from 'why' to 'how'. Although we have already seen improvements in our metrics, we are just now feeling a shift in mindset which will bear fruit in the future."
5/5

Stuart Pearce
Portfolio CTO, Hg Capital
"We are here to help our portfolio companies accelerate their value delivery. The effectiveness of their technology delivery - and the ROI of their R&D – is a key piece of that jigsaw. Plandek enables our portfolio companies to track and drive their R&D ROI, as part of their broader value creation approach."
5/5

Giulio Folino
Head of Digital, MoJ
"At the MoJ, we believe that data is the best way to drive continual improvement and build an effective delivery culture. Plandek has enabled us to focus our organization on the delivery behaviors that drive the right outcomes, whilst providing our people with a robust tool to support coaching and learning opportunities."
5/5

Eirik Pettersen
CTO, Secret Escapes
"It is early days with Plandek, but it is already making an important contribution to our collective effort to constantly improve our already world-class Agile engineering capability at Secret Escapes."
5/5
Neil Sayer
Head of Technology, PEI
“We want to measure, so we have made Plandek our new norm for every team. It consistently provides us with high quality, up-to-date transparency into our processes.”
5/5
Jayr Motta
Head of Engineering
"After almost 2 years with Plandek, the conversation has shifted a lot among the leaders and many team members from 'why' to 'how'. Although we have already seen improvements in our metrics, we are just now feeling a shift in mindset which will bear fruit in the future."
5/5
Giulio Folino
Head of Digital, MoJ
"At the MoJ, we believe that data is the best way to drive continual improvement and build an effective delivery culture. Plandek has enabled us to focus our organization on the delivery behaviors that drive the right outcomes, whilst providing our people with a robust tool to support coaching and learning opportunities."
5/5
Andrew Mulford
VP Head of Delivery, Preqin
"The Plandek team supported us when we needed to make customization and changes. It's a very quick and simple tool to use. We can create custom dashboards, which focus on specific teams, but it also enables us to scale."
5/5
Stuart Pearce
Portfolio CTO, Hg Capital
"We are here to help our portfolio companies accelerate their value delivery. The effectiveness of their technology delivery - and the ROI of their R&D – is a key piece of that jigsaw. Plandek enables our portfolio companies to track and drive their R&D ROI, as part of their broader value creation approach."
5/5
Eirik Pettersen
CTO, Secret Escapes
"It is early days with Plandek, but it is already making an important contribution to our collective effort to constantly improve our already world-class Agile engineering capability at Secret Escapes."
5/5
Giulio Folino
Head of Digital, MoJ
"At the MoJ, we believe that data is the best way to drive continual improvement and build an effective delivery culture. Plandek has enabled us to focus our organization on the delivery behaviors that drive the right outcomes, whilst providing our people with a robust tool to support coaching and learning opportunities."
5/5
Jayr Motta
Head of Engineering
"After almost 2 years with Plandek, the conversation has shifted a lot among the leaders and many team members from 'why' to 'how'. Although we have already seen improvements in our metrics, we are just now feeling a shift in mindset which will bear fruit in the future."
5/5
Stuart Pearce
Portfolio CTO, Hg Capital
"We are here to help our portfolio companies accelerate their value delivery. The effectiveness of their technology delivery - and the ROI of their R&D – is a key piece of that jigsaw. Plandek enables our portfolio companies to track and drive their R&D ROI, as part of their broader value creation approach."
5/5
Neil Sayer
Head of Technology, PEI
“We want to measure, so we have made Plandek our new norm for every team. It consistently provides us with high quality, up-to-date transparency into our processes.”
5/5
Andrew Mulford
VP Head of Delivery, Preqin
"The Plandek team supported us when we needed to make customization and changes. It's a very quick and simple tool to use. We can create custom dashboards, which focus on specific teams, but it also enables us to scale."
5/5
Eirik Pettersen
CTO, Secret Escapes
"It is early days with Plandek, but it is already making an important contribution to our collective effort to constantly improve our already world-class Agile engineering capability at Secret Escapes."
5/5
Software Engineering Intelligence
Platform FAQS
Frequently
asked questions
What is a Software Engineering Intelligence (SEI) platform?
A Software Engineering Intelligence (SEI) platform is a comprehensive solution designed to collect, analyze, and visualize data from your software delivery process. It provides real-time insights into key performance metrics, enabling teams to track their progress, identify bottlenecks, and make data-driven decisions. By integrating with existing tools like Jira, GitHub, and CI/CD pipelines, an SEI platform helps organizations optimize their software development lifecycle, improve collaboration, and enhance overall delivery performance.
What is a Software Engineering Intelligence (SEI) platform?
A Software Engineering Intelligence (SEI) platform is a comprehensive solution designed to collect, analyze, and visualize data from your software delivery process. It provides real-time insights into key performance metrics, enabling teams to track their progress, identify bottlenecks, and make data-driven decisions. By integrating with existing tools like Jira, GitHub, and CI/CD pipelines, an SEI platform helps organizations optimize their software development lifecycle, improve collaboration, and enhance overall delivery performance.
What software delivery metrics does Plandek track?
What software delivery metrics does Plandek track?
How can Plandek improve my software delivery performance?
How can Plandek improve my software delivery performance?
Does Plandek integrate with my existing tools?
Does Plandek integrate with my existing tools?
See how your engineering efforts translate into measurable business impact
Measure delivery performance, AI impact, and engineering productivity with hundreds of metrics, OOTB dashboards and custom configurations.



Platform
Platform
Contact us
UK Office
Unit 313 The Print Rooms, 164-180
Union St, London SE1 0LH
US Office
Floor 4, 1515 Mockingbird Ln,
Charlotte, NC 28209, USA