Your voice matters: Join the GenAI adoption conversation - contribute to our industry research. Take the survey >

Unlock the Key Metrics to Drive Engineering & Software Success

Discover how space metrics, flow metrics and sprint performance can optimize your software delivery. Download our free guide now and improve your team’s efficiency today.

engineering-teams-metrics-guide

Here’s what you’ll get:

<svg xmlns="http://www.w3.org/2000/svg" height="20px" viewBox="0 -960 960 960" width="20px" fill="#ff6100"><path d="m427.46-410.31-73.84-72.84q-5.62-5.62-10.77-6-5.16-.39-11.54 6-6.39 6.38-6.39 11.65 0 5.27 6.39 11.65l76.54 76.54q8.69 8.69 19.61 8.69t19.62-8.69l180.07-180.07q5.62-5.62 6-11.27.39-5.66-6-12.04-6.38-6.39-11.15-6.39-4.77 0-11.15 6.39L427.46-410.31ZM480.13-136q-70.67 0-133.41-26.84-62.73-26.84-109.86-73.92t-73.99-109.76Q136-409.19 136-479.87q0-71.67 26.84-133.91 26.84-62.23 73.92-109.36t109.76-73.99Q409.19-824 479.87-824q71.67 0 133.91 26.84 62.23 26.84 109.36 73.92t73.99 109.26Q824-551.81 824-480.13q0 70.67-26.84 133.41-26.84 62.73-73.92 109.86t-109.26 73.99Q551.81-136 480.13-136Zm-.13-32q130 0 221-91t91-221q0-130-91-221t-221-91q-130 0-221 91t-91 221q0 130 91 221t221 91Zm0-312Z"/></svg>An overview on end-to-end software delivery metrics

<svg xmlns="http://www.w3.org/2000/svg" height="20px" viewBox="0 -960 960 960" width="20px" fill="#ff6100"><path d="m427.46-410.31-73.84-72.84q-5.62-5.62-10.77-6-5.16-.39-11.54 6-6.39 6.38-6.39 11.65 0 5.27 6.39 11.65l76.54 76.54q8.69 8.69 19.61 8.69t19.62-8.69l180.07-180.07q5.62-5.62 6-11.27.39-5.66-6-12.04-6.38-6.39-11.15-6.39-4.77 0-11.15 6.39L427.46-410.31ZM480.13-136q-70.67 0-133.41-26.84-62.73-26.84-109.86-73.92t-73.99-109.76Q136-409.19 136-479.87q0-71.67 26.84-133.91 26.84-62.23 73.92-109.36t109.76-73.99Q409.19-824 479.87-824q71.67 0 133.91 26.84 62.23 26.84 109.36 73.92t73.99 109.26Q824-551.81 824-480.13q0 70.67-26.84 133.41-26.84 62.73-73.92 109.86t-109.26 73.99Q551.81-136 480.13-136Zm-.13-32q130 0 221-91t91-221q0-130-91-221t-221-91q-130 0-221 91t-91 221q0 130 91 221t221 91Zm0-312Z"/></svg>Real-life use cases

<svg xmlns="http://www.w3.org/2000/svg" height="20px" viewBox="0 -960 960 960" width="20px" fill="#ff6100"><path d="m427.46-410.31-73.84-72.84q-5.62-5.62-10.77-6-5.16-.39-11.54 6-6.39 6.38-6.39 11.65 0 5.27 6.39 11.65l76.54 76.54q8.69 8.69 19.61 8.69t19.62-8.69l180.07-180.07q5.62-5.62 6-11.27.39-5.66-6-12.04-6.38-6.39-11.15-6.39-4.77 0-11.15 6.39L427.46-410.31ZM480.13-136q-70.67 0-133.41-26.84-62.73-26.84-109.86-73.92t-73.99-109.76Q136-409.19 136-479.87q0-71.67 26.84-133.91 26.84-62.23 73.92-109.36t109.76-73.99Q409.19-824 479.87-824q71.67 0 133.91 26.84 62.23 26.84 109.36 73.92t73.99 109.26Q824-551.81 824-480.13q0 70.67-26.84 133.41-26.84 62.73-73.92 109.86t-109.26 73.99Q551.81-136 480.13-136Zm-.13-32q130 0 221-91t91-221q0-130-91-221t-221-91q-130 0-221 91t-91 221q0 130 91 221t221 91Zm0-312Z"/></svg>How the C-Suite can use these for their software delivery success

Discover how space metrics, flow metrics and sprint performance can optimize your software delivery. Download our free guide now and improve your team’s efficiency today.

Here’s what you’ll get:

<svg xmlns="http://www.w3.org/2000/svg" height="20px" viewBox="0 -960 960 960" width="20px" fill="#ff6100"><path d="m427.46-410.31-73.84-72.84q-5.62-5.62-10.77-6-5.16-.39-11.54 6-6.39 6.38-6.39 11.65 0 5.27 6.39 11.65l76.54 76.54q8.69 8.69 19.61 8.69t19.62-8.69l180.07-180.07q5.62-5.62 6-11.27.39-5.66-6-12.04-6.38-6.39-11.15-6.39-4.77 0-11.15 6.39L427.46-410.31ZM480.13-136q-70.67 0-133.41-26.84-62.73-26.84-109.86-73.92t-73.99-109.76Q136-409.19 136-479.87q0-71.67 26.84-133.91 26.84-62.23 73.92-109.36t109.76-73.99Q409.19-824 479.87-824q71.67 0 133.91 26.84 62.23 26.84 109.36 73.92t73.99 109.26Q824-551.81 824-480.13q0 70.67-26.84 133.41-26.84 62.73-73.92 109.86t-109.26 73.99Q551.81-136 480.13-136Zm-.13-32q130 0 221-91t91-221q0-130-91-221t-221-91q-130 0-221 91t-91 221q0 130 91 221t221 91Zm0-312Z"/></svg>An overview on end-to-end software delivery metrics

<svg xmlns="http://www.w3.org/2000/svg" height="20px" viewBox="0 -960 960 960" width="20px" fill="#ff6100"><path d="m427.46-410.31-73.84-72.84q-5.62-5.62-10.77-6-5.16-.39-11.54 6-6.39 6.38-6.39 11.65 0 5.27 6.39 11.65l76.54 76.54q8.69 8.69 19.61 8.69t19.62-8.69l180.07-180.07q5.62-5.62 6-11.27.39-5.66-6-12.04-6.38-6.39-11.15-6.39-4.77 0-11.15 6.39L427.46-410.31ZM480.13-136q-70.67 0-133.41-26.84-62.73-26.84-109.86-73.92t-73.99-109.76Q136-409.19 136-479.87q0-71.67 26.84-133.91 26.84-62.23 73.92-109.36t109.76-73.99Q409.19-824 479.87-824q71.67 0 133.91 26.84 62.23 26.84 109.36 73.92t73.99 109.26Q824-551.81 824-480.13q0 70.67-26.84 133.41-26.84 62.73-73.92 109.86t-109.26 73.99Q551.81-136 480.13-136Zm-.13-32q130 0 221-91t91-221q0-130-91-221t-221-91q-130 0-221 91t-91 221q0 130 91 221t221 91Zm0-312Z"/></svg>Real-life use cases

<svg xmlns="http://www.w3.org/2000/svg" height="20px" viewBox="0 -960 960 960" width="20px" fill="#ff6100"><path d="m427.46-410.31-73.84-72.84q-5.62-5.62-10.77-6-5.16-.39-11.54 6-6.39 6.38-6.39 11.65 0 5.27 6.39 11.65l76.54 76.54q8.69 8.69 19.61 8.69t19.62-8.69l180.07-180.07q5.62-5.62 6-11.27.39-5.66-6-12.04-6.38-6.39-11.15-6.39-4.77 0-11.15 6.39L427.46-410.31ZM480.13-136q-70.67 0-133.41-26.84-62.73-26.84-109.86-73.92t-73.99-109.76Q136-409.19 136-479.87q0-71.67 26.84-133.91 26.84-62.23 73.92-109.36t109.76-73.99Q409.19-824 479.87-824q71.67 0 133.91 26.84 62.23 26.84 109.36 73.92t73.99 109.26Q824-551.81 824-480.13q0 70.67-26.84 133.41-26.84 62.73-73.92 109.86t-109.26 73.99Q551.81-136 480.13-136Zm-.13-32q130 0 221-91t91-221q0-130-91-221t-221-91q-130 0-221 91t-91 221q0 130 91 221t221 91Zm0-312Z"/></svg>How the C-Suite can use these for their software delivery success

plandek-badges

Why Engineering Metrics Matter for Engineering & Software Teams

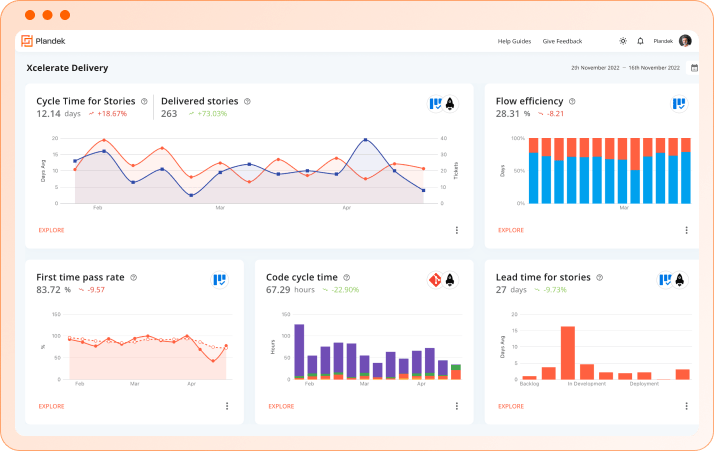
What are the key KPIs for engineering teams?

Key metrics for engineering teams are measurable indicators that provide insights into the performance, efficiency, and health of software delivery and development processes. These metrics help track the progress of engineering tasks, identify bottlenecks, and guide decision-making.

Some of the most critical metrics include:

<svg xmlns="http://www.w3.org/2000/svg" height="24px" viewBox="0 -960 960 960" width="24px" fill="#ff6100"><path d="M480.77-160q-66.6 0-124.76-25.04-58.16-25.04-101.66-68.54-43.5-43.5-68.54-101.65-25.04-58.14-25.04-124.73 0-66.58 25.04-124.77t68.54-101.69q43.5-43.5 101.66-68.54Q414.17-800 480.77-800q68.92 0 131.27 28.46 62.34 28.46 108.73 79.39v-75.54q0-8.5 5.76-14.25t14.27-5.75q8.51 0 14.24 5.75t5.73 14.25v113.84q0 13.73-9.29 23.02t-23.02 9.29H614.62q-8.5 0-14.25-5.76-5.75-5.75-5.75-14.27 0-8.51 5.75-14.24t14.25-5.73h79.23q-41.77-46-96.39-72.23Q542.85-760 480.77-760q-117 0-198.5 81.5T200.77-480q0 117 81.5 198.5t198.5 81.5q98.85 0 175-62t97.85-157.38q2.69-9.08 9.15-14 6.46-4.93 15-3.7 9.08 1.23 13.31 8.73t1.77 16.35Q770-301.46 683-230.73T480.77-160Zm20-328.31 120 120q5.61 5.62 6 13.77.38 8.16-6 14.54-6.39 6.38-14.15 6.38-7.77 0-14.16-6.38l-122-122q-5.23-5.23-7.46-10.97-2.23-5.75-2.23-11.88V-660q0-8.5 5.76-14.25 5.75-5.75 14.27-5.75 8.51 0 14.24 5.75t5.73 14.25v171.69Z"/></svg>Cycle Time: The time it takes for a task to move from start to finish. This metric helps measure the efficiency of your team’s workflow and shows where delays may be occurring.
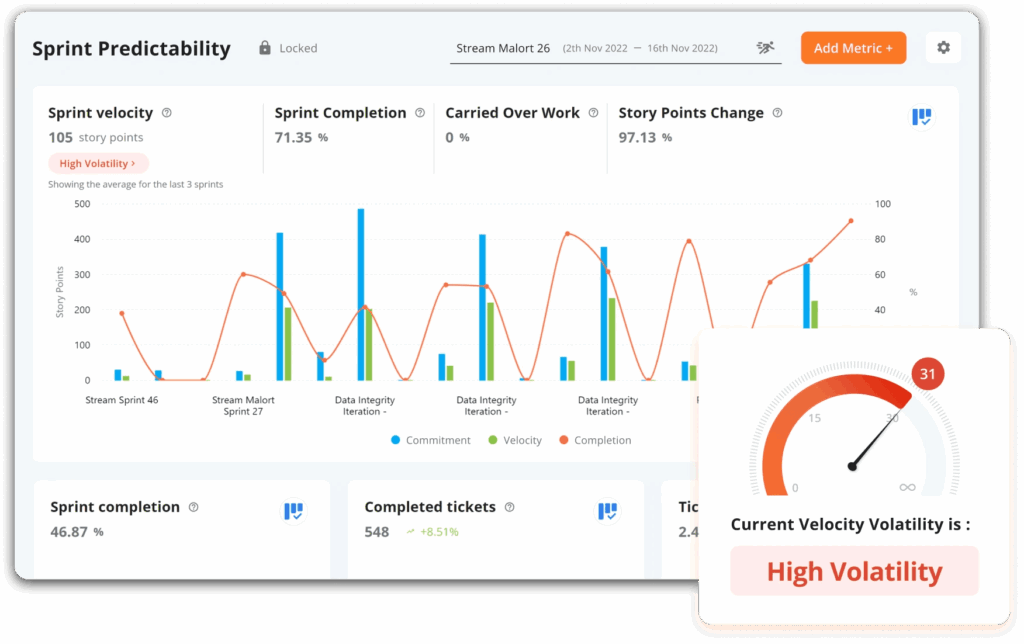
<svg xmlns="http://www.w3.org/2000/svg" height="24px" viewBox="0 -960 960 960" width="24px" fill="#ff6100"><path d="M430.31-352.31q18.61 18.62 47.77 16.96 29.15-1.65 42.54-20.96l153.66-214.37q8.18-11.86-1.4-21.44-9.57-9.57-21.47-1.43l-215.1 152.93q-20.08 13.39-22.35 41.54-2.27 28.16 16.35 46.77ZM480-760q42.92 0 79.85 8.31 36.92 8.31 72.23 25.15 8.3 3.69 14.38 12.12 6.08 8.42 2.31 15.73-3.77 7.31-14.85 9.61-11.07 2.31-19.61-1.38-31.16-15.16-63.96-22.35Q517.54-720 480-720q-133 0-226.5 93.5T160-400q0 42 11.5 83t32.5 77h552q23-38 33.5-79t10.5-85q0-30.62-6.81-65.23-6.81-34.62-21.96-65.54-3.69-8.54-2-16.85 1.69-8.3 8.91-13.26 6.71-4.5 14.51-2.04 7.81 2.46 11.5 10.3 19.62 40.39 27.62 76.89t8.23 75.27q.23 51.61-11.46 96.31-11.69 44.69-36.39 90.15-4.84 8-14.61 13T756-200H204q-11 0-20.38-5.38-9.39-5.39-15.77-15.7-19.85-35-33.85-78.96Q120-344 120-400q0-73.77 27.98-139.24 27.98-65.48 76.38-114.7 48.41-49.21 114.49-77.64Q404.92-760 480-760Zm1.62 278.38Z"/></svg>Sprint Velocity: The amount of work completed during a sprint. Tracking velocity helps predict future performance and plan realistic sprints so you can manage the expectations of your engineering team.

<svg xmlns="http://www.w3.org/2000/svg" height="24px" viewBox="0 -960 960 960" width="24px" fill="#ff6100"><path d="M300-743.62Q229.62-695 194.81-626.27 160-557.54 160-480q0 110.38 66.15 196.27 66.16 85.88 175.47 113.96 8.07 2.46 13.23 9.42 5.15 6.97 5.15 15.27 0 8.31-6.38 13.54-6.39 5.23-13.47 3-123.84-29.08-202-125.88Q120-351.23 120-480q0-86.38 37.27-160.69t111.81-130.08H170q-8.54 0-14.27-5.73T150-790.77q0-8.54 5.73-14.27t14.27-5.73h137.69q13.93 0 23.12 9.19 9.19 9.2 9.19 23.12v137.69q0 8.54-5.73 14.27T320-620.77q-8.54 0-14.27-5.73T300-640.77v-102.85Zm123 363.08 212.85-212.84q5.84-5.85 13.77-6.12 7.92-.27 14.53 6.35 6.39 6.61 6.5 14.15.12 7.54-6.5 14.15L445.62-346.31q-9.7 9.69-22.62 9.69-12.92 0-22.62-9.69L295.85-451.08q-5.62-5.61-6.12-13.65t6.12-14.65q6.38-6.39 14.15-6.39 7.77 0 14.15 6.39L423-380.54Zm267.92 192.08H790q8.54 0 14.27 5.73t5.73 14.27q0 8.54-5.73 14.27T790-148.46H652.31q-13.93 0-23.12-9.19-9.19-9.2-9.19-23.12v-137.69q0-8.54 5.73-14.27t14.27-5.73q8.54 0 14.27 5.73t5.73 14.27v102.84q69.62-49.61 104.81-118.23Q800-402.46 800-480q0-110.38-66.15-196.27-66.16-85.88-175.47-113.96-8.07-2.46-13.23-9.04-5.15-6.58-5.15-14.88 0-8.31 6.38-13.93 6.39-5.61 13.47-3.38 123.84 28.31 202 125.5Q840-608.77 840-480q0 86.38-37.27 161.08-37.27 74.69-111.81 130.46Z"/></svg>Deployment Frequency: The rate at which your team deploys code to production. Frequent deployments indicate a smooth delivery pipeline, while delays may signal inefficiencies.

<svg xmlns="http://www.w3.org/2000/svg" height="24px" viewBox="0 -960 960 960" width="24px" fill="#ff6100"><path d="M480.13-120q-74.67 0-140.41-28.34-65.73-28.34-114.36-76.92-48.63-48.58-76.99-114.26Q120-405.19 120-479.87q0-74.67 28.35-140.41 28.35-65.73 76.95-114.36 48.6-48.63 114.3-76.99Q405.3-840 480-840q8.5 0 14.25 5.75T500-820v305.62q10.31 6.38 15.15 14.86 4.85 8.47 4.85 19.61 0 15.99-11.96 27.95Q496.08-440 480-440t-28.04-11.96Q440-463.92 440-479.82q0-11.07 4.85-19.74 4.84-8.67 15.15-14.82v-123.7q-59.69 7.08-99.85 51.89Q320-541.38 320-480q0 66 47 113t113 47q66 0 113-47t47-113q0-30.62-10.96-57.23-10.96-26.62-29.35-48.15-5.38-7.08-5.54-14.85-.15-7.77 6.07-13.99 6.78-6.78 14.82-6.4 8.04.39 14.19 7.47Q653-586 666.5-552.46 680-518.92 680-480q0 83.33-58.28 141.67Q563.44-280 480.18-280q-83.26 0-141.72-58.33Q280-396.67 280-480q0-78.46 52-134.96 52-56.5 128-63.58v-121q-125.92 7.31-212.96 99.23Q160-608.38 160-480q0 134 93 227t227 93q134 0 227-93t93-227q0-63.38-22.08-118.35-22.07-54.96-62.46-97.73-6.38-6.84-7.54-15.77-1.15-8.92 5.46-15.53 6.62-6.62 15.04-5.74 8.43.89 14.81 7.74 45 49.15 70.89 111.3Q840-551.92 840-480q0 74.7-28.34 140.4t-76.92 114.3q-48.58 48.6-114.26 76.95Q554.81-120 480.13-120Z"/></svg>Lead Time for Changes: The time it takes from code commit to deployment. Shorter lead times mean your team is responding faster to business needs and shipping features quickly.

<svg xmlns="http://www.w3.org/2000/svg" height="24px" viewBox="0 -960 960 960" width="24px" fill="#ff6100"><path d="M480-289.23q-12.38 0-21.58-9.19-9.19-9.2-9.19-21.58 0-12.38 9.19-21.58 9.2-9.19 21.58-9.19 12.38 0 21.58 9.19 9.19 9.2 9.19 21.58 0 12.38-9.19 21.58-9.2 9.19-21.58 9.19Zm-.03-141.54q-8.51 0-14.24-5.75T460-450.77V-640q0-8.5 5.76-14.25t14.27-5.75q8.51 0 14.24 5.75T500-640v189.23q0 8.5-5.76 14.25t-14.27 5.75Zm-281.51-46.15q0 60.87 25.73 112.17 25.73 51.29 91.19 108.9v-101.07q0-8.5 5.76-14.25t14.27-5.75q8.51 0 14.24 5.75t5.73 14.25v138.46q0 13.73-9.28 23.02-9.29 9.29-23.02 9.29H184.62q-8.5 0-14.25-5.76t-5.75-14.27q0-8.51 5.75-14.24t14.25-5.73h103.61q-71.77-62.47-100.77-122.93-29-60.46-29-128.12 0-88.34 45.92-160.88 45.93-72.54 120.31-110.23 7.85-4.15 16.04-1.38 8.19 2.77 10.89 11.07 2.69 8.31-.85 16.02-3.54 7.72-11.15 11.83-63.7 32.54-102.43 95.35-38.73 62.8-38.73 138.5Zm563.08-6.16q0-60.87-25.73-112.17-25.73-51.29-91.19-108.9v101.07q0 8.5-5.76 14.25t-14.27 5.75q-8.51 0-14.24-5.75t-5.73-14.25v-138.46q0-13.73 9.28-23.02 9.29-9.29 23.02-9.29h138.46q8.5 0 14.25 5.76t5.75 14.27q0 8.51-5.75 14.24t-14.25 5.73H671.77q71.77 62.47 100.77 122.93 29 60.46 29 128.12 0 88.34-46.02 160.87-46.02 72.54-120.21 110.47-7.85 4.15-16.04 1.27-8.19-2.89-10.89-11.19-2.69-8.31.85-16.02 3.54-7.72 11.15-11.83 63.7-32.54 102.43-95.35 38.73-62.8 38.73-138.5Z"/></svg>Mean Time to Recovery (MTTR): The average time it takes to recover from a failure or issue in production. A lower MTTR indicates more reliable systems and faster recovery times.

Why Track These Metrics?

Tracking these key metrics provides several benefits for engineering teams:

  • Improved Performance: By measuring cycle times and velocity, teams can identify areas for improvement and optimize their workflows to be more productive.
  • Data-Driven Decisions: Metrics allow engineering managers to make informed decisions based on real performance data rather than assumptions.
  • Faster Delivery: By monitoring deployment frequency and lead time, teams can continuously improve their software delivery processes, delivering value to customers faster.
  • Enhanced Team Collaboration: Metrics like sprint velocity and cycle time promote accountability and transparency, leading to better collaboration within teams.

Tracking these essential engineering metrics enables teams to optimize their software delivery, boost productivity, and deliver high-quality software at a faster pace.

Trusted by global technology companies

Download the Ultimate Guide to Software Delivery & Engineering Metrics

In today’s fast-paced engineering environments, tracking the right metrics is crucial to improving team performance, enhancing productivity, and delivering software faster. Understanding which metrics to focus on – whether it’s sprint performance, space metrics, or developer experience – can help your team reach its full potential.

What’s in the Guide?

Engineering and software delivery teams rely on metrics to optimize performance and ensure project success. Plandek’s Ultimate Guide to Software Delivery & Engineering Metrics covers the most important metrics that high-performing teams should track to drive continuous improvement.

In this guide, you’ll discover:

<svg xmlns="http://www.w3.org/2000/svg" height="20px" viewBox="0 -960 960 960" width="20px" fill="#ff6100"><path d="m427.46-410.31-73.84-72.84q-5.62-5.62-10.77-6-5.16-.39-11.54 6-6.39 6.38-6.39 11.65 0 5.27 6.39 11.65l76.54 76.54q8.69 8.69 19.61 8.69t19.62-8.69l180.07-180.07q5.62-5.62 6-11.27.39-5.66-6-12.04-6.38-6.39-11.15-6.39-4.77 0-11.15 6.39L427.46-410.31ZM480.13-136q-70.67 0-133.41-26.84-62.73-26.84-109.86-73.92t-73.99-109.76Q136-409.19 136-479.87q0-71.67 26.84-133.91 26.84-62.23 73.92-109.36t109.76-73.99Q409.19-824 479.87-824q71.67 0 133.91 26.84 62.23 26.84 109.36 73.92t73.99 109.26Q824-551.81 824-480.13q0 70.67-26.84 133.41-26.84 62.73-73.92 109.86t-109.26 73.99Q551.81-136 480.13-136Zm-.13-32q130 0 221-91t91-221q0-130-91-221t-221-91q-130 0-221 91t-91 221q0 130 91 221t221 91Zm0-312Z"/></svg>Engineering Metrics that focus on tracking team productivity, quality, and overall efficiency. These metrics help ensure your team is aligned with business goals and delivering value.

<svg xmlns="http://www.w3.org/2000/svg" height="20px" viewBox="0 -960 960 960" width="20px" fill="#ff6100"><path d="m427.46-410.31-73.84-72.84q-5.62-5.62-10.77-6-5.16-.39-11.54 6-6.39 6.38-6.39 11.65 0 5.27 6.39 11.65l76.54 76.54q8.69 8.69 19.61 8.69t19.62-8.69l180.07-180.07q5.62-5.62 6-11.27.39-5.66-6-12.04-6.38-6.39-11.15-6.39-4.77 0-11.15 6.39L427.46-410.31ZM480.13-136q-70.67 0-133.41-26.84-62.73-26.84-109.86-73.92t-73.99-109.76Q136-409.19 136-479.87q0-71.67 26.84-133.91 26.84-62.23 73.92-109.36t109.76-73.99Q409.19-824 479.87-824q71.67 0 133.91 26.84 62.23 26.84 109.36 73.92t73.99 109.26Q824-551.81 824-480.13q0 70.67-26.84 133.41-26.84 62.73-73.92 109.86t-109.26 73.99Q551.81-136 480.13-136Zm-.13-32q130 0 221-91t91-221q0-130-91-221t-221-91q-130 0-221 91t-91 221q0 130 91 221t221 91Zm0-312Z"/></svg>Sprint Performance Metrics such as Velocity, Cycle Time, and Lead Time for Changes, which provide insights into how efficiently your team completes work and improves sprint outcomes.

<svg xmlns="http://www.w3.org/2000/svg" height="20px" viewBox="0 -960 960 960" width="20px" fill="#ff6100"><path d="m427.46-410.31-73.84-72.84q-5.62-5.62-10.77-6-5.16-.39-11.54 6-6.39 6.38-6.39 11.65 0 5.27 6.39 11.65l76.54 76.54q8.69 8.69 19.61 8.69t19.62-8.69l180.07-180.07q5.62-5.62 6-11.27.39-5.66-6-12.04-6.38-6.39-11.15-6.39-4.77 0-11.15 6.39L427.46-410.31ZM480.13-136q-70.67 0-133.41-26.84-62.73-26.84-109.86-73.92t-73.99-109.76Q136-409.19 136-479.87q0-71.67 26.84-133.91 26.84-62.23 73.92-109.36t109.76-73.99Q409.19-824 479.87-824q71.67 0 133.91 26.84 62.23 26.84 109.36 73.92t73.99 109.26Q824-551.81 824-480.13q0 70.67-26.84 133.41-26.84 62.73-73.92 109.86t-109.26 73.99Q551.81-136 480.13-136Zm-.13-32q130 0 221-91t91-221q0-130-91-221t-221-91q-130 0-221 91t-91 221q0 130 91 221t221 91Zm0-312Z"/></svg>Space Metrics that highlight how both physical and virtual team environments impact workflow efficiency and collaboration.

<svg xmlns="http://www.w3.org/2000/svg" height="20px" viewBox="0 -960 960 960" width="20px" fill="#ff6100"><path d="m427.46-410.31-73.84-72.84q-5.62-5.62-10.77-6-5.16-.39-11.54 6-6.39 6.38-6.39 11.65 0 5.27 6.39 11.65l76.54 76.54q8.69 8.69 19.61 8.69t19.62-8.69l180.07-180.07q5.62-5.62 6-11.27.39-5.66-6-12.04-6.38-6.39-11.15-6.39-4.77 0-11.15 6.39L427.46-410.31ZM480.13-136q-70.67 0-133.41-26.84-62.73-26.84-109.86-73.92t-73.99-109.76Q136-409.19 136-479.87q0-71.67 26.84-133.91 26.84-62.23 73.92-109.36t109.76-73.99Q409.19-824 479.87-824q71.67 0 133.91 26.84 62.23 26.84 109.36 73.92t73.99 109.26Q824-551.81 824-480.13q0 70.67-26.84 133.41-26.84 62.73-73.92 109.86t-109.26 73.99Q551.81-136 480.13-136Zm-.13-32q130 0 221-91t91-221q0-130-91-221t-221-91q-130 0-221 91t-91 221q0 130 91 221t221 91Zm0-312Z"/></svg>Software Delivery Metrics like Deployment Frequency and Mean Time to Recovery (MTTR) that ensure faster, reliable releases and higher software quality.

<svg xmlns="http://www.w3.org/2000/svg" height="20px" viewBox="0 -960 960 960" width="20px" fill="#ff6100"><path d="m427.46-410.31-73.84-72.84q-5.62-5.62-10.77-6-5.16-.39-11.54 6-6.39 6.38-6.39 11.65 0 5.27 6.39 11.65l76.54 76.54q8.69 8.69 19.61 8.69t19.62-8.69l180.07-180.07q5.62-5.62 6-11.27.39-5.66-6-12.04-6.38-6.39-11.15-6.39-4.77 0-11.15 6.39L427.46-410.31ZM480.13-136q-70.67 0-133.41-26.84-62.73-26.84-109.86-73.92t-73.99-109.76Q136-409.19 136-479.87q0-71.67 26.84-133.91 26.84-62.23 73.92-109.36t109.76-73.99Q409.19-824 479.87-824q71.67 0 133.91 26.84 62.23 26.84 109.36 73.92t73.99 109.26Q824-551.81 824-480.13q0 70.67-26.84 133.41-26.84 62.73-73.92 109.86t-109.26 73.99Q551.81-136 480.13-136Zm-.13-32q130 0 221-91t91-221q0-130-91-221t-221-91q-130 0-221 91t-91 221q0 130 91 221t221 91Zm0-312Z"/></svg>Practical examples of how to apply metrics in real-world engineering scenarios.

engineering-teams-metrics-guide

Trusted by Engineering & Software Delivery Teams Globally

How Plandek Helps You Measure Key Metrics to Drive Engineering & Software Delivery Success

engineering-teams-metrics-sprint-delivery

Plandek is a leading software delivery intelligence platform that helps engineering and software teams track the metrics that truly matter. By providing real-time insights into your team’s performance and delivery processes, Plandek enables you to continuously improve and achieve better outcomes.

With Plandek, you can:

<svg xmlns="http://www.w3.org/2000/svg" height="20px" viewBox="0 -960 960 960" width="20px" fill="#ff6100"><path d="M666.15-464H247.98q-6.83 0-11.41-4.52-4.57-4.52-4.57-11.27t4.57-11.48q4.58-4.73 11.41-4.73h418.17L468.4-693.75q-4.63-4.63-5.4-11.06-.77-6.42 4.85-12.51 5.61-5.91 11.65-5.53 6.04.39 11.46 5.83l217.02 217.31q4.64 4.64 6.75 9.42 2.12 4.77 2.12 10.45t-2.12 10.45q-2.11 4.77-6.35 9.01L491.15-243.15q-5.61 5.61-11.15 5.5-5.54-.12-11.15-6.03-5.62-6.09-5.62-11.91t5.62-11.1L666.15-464Z"/></svg>Track Essential Engineering Metrics
<svg xmlns="http://www.w3.org/2000/svg" height="20px" viewBox="0 -960 960 960" width="20px" fill="#ff6100"><path d="M666.15-464H247.98q-6.83 0-11.41-4.52-4.57-4.52-4.57-11.27t4.57-11.48q4.58-4.73 11.41-4.73h418.17L468.4-693.75q-4.63-4.63-5.4-11.06-.77-6.42 4.85-12.51 5.61-5.91 11.65-5.53 6.04.39 11.46 5.83l217.02 217.31q4.64 4.64 6.75 9.42 2.12 4.77 2.12 10.45t-2.12 10.45q-2.11 4.77-6.35 9.01L491.15-243.15q-5.61 5.61-11.15 5.5-5.54-.12-11.15-6.03-5.62-6.09-5.62-11.91t5.62-11.1L666.15-464Z"/></svg>Monitor Software Delivery Health
<svg xmlns="http://www.w3.org/2000/svg" height="20px" viewBox="0 -960 960 960" width="20px" fill="#ff6100"><path d="M666.15-464H247.98q-6.83 0-11.41-4.52-4.57-4.52-4.57-11.27t4.57-11.48q4.58-4.73 11.41-4.73h418.17L468.4-693.75q-4.63-4.63-5.4-11.06-.77-6.42 4.85-12.51 5.61-5.91 11.65-5.53 6.04.39 11.46 5.83l217.02 217.31q4.64 4.64 6.75 9.42 2.12 4.77 2.12 10.45t-2.12 10.45q-2.11 4.77-6.35 9.01L491.15-243.15q-5.61 5.61-11.15 5.5-5.54-.12-11.15-6.03-5.62-6.09-5.62-11.91t5.62-11.1L666.15-464Z"/></svg>Optimize Sprint Performance

By implementing Plandek, your engineering team will have the tools needed to make informed decisions, improve workflow efficiency, and deliver high-quality software faster. Experience Plandek to achieve better software delivery performance today, by booking your free demo or downloading our Intro Deck for more information.

Download Now: The Ultimate Guide to Software Delivery & Engineering Metrics

Your competition is already using metrics to optimize their software delivery and improve team efficiency. Don’t get left behind. Start tracking the right metrics to improve your performance, streamline sprints, and enhance developer experience. This guide is perfect for:

<svg xmlns="http://www.w3.org/2000/svg" height="20px" viewBox="0 -960 960 960" width="20px" fill="#ff6100"><path d="m427.46-410.31-73.84-72.84q-5.62-5.62-10.77-6-5.16-.39-11.54 6-6.39 6.38-6.39 11.65 0 5.27 6.39 11.65l76.54 76.54q8.69 8.69 19.61 8.69t19.62-8.69l180.07-180.07q5.62-5.62 6-11.27.39-5.66-6-12.04-6.38-6.39-11.15-6.39-4.77 0-11.15 6.39L427.46-410.31ZM480.13-136q-70.67 0-133.41-26.84-62.73-26.84-109.86-73.92t-73.99-109.76Q136-409.19 136-479.87q0-71.67 26.84-133.91 26.84-62.23 73.92-109.36t109.76-73.99Q409.19-824 479.87-824q71.67 0 133.91 26.84 62.23 26.84 109.36 73.92t73.99 109.26Q824-551.81 824-480.13q0 70.67-26.84 133.41-26.84 62.73-73.92 109.86t-109.26 73.99Q551.81-136 480.13-136Zm-.13-32q130 0 221-91t91-221q0-130-91-221t-221-91q-130 0-221 91t-91 221q0 130 91 221t221 91Zm0-312Z"/></svg>Engineering Managers looking to track team performance and delivery.

<svg xmlns="http://www.w3.org/2000/svg" height="20px" viewBox="0 -960 960 960" width="20px" fill="#ff6100"><path d="m427.46-410.31-73.84-72.84q-5.62-5.62-10.77-6-5.16-.39-11.54 6-6.39 6.38-6.39 11.65 0 5.27 6.39 11.65l76.54 76.54q8.69 8.69 19.61 8.69t19.62-8.69l180.07-180.07q5.62-5.62 6-11.27.39-5.66-6-12.04-6.38-6.39-11.15-6.39-4.77 0-11.15 6.39L427.46-410.31ZM480.13-136q-70.67 0-133.41-26.84-62.73-26.84-109.86-73.92t-73.99-109.76Q136-409.19 136-479.87q0-71.67 26.84-133.91 26.84-62.23 73.92-109.36t109.76-73.99Q409.19-824 479.87-824q71.67 0 133.91 26.84 62.23 26.84 109.36 73.92t73.99 109.26Q824-551.81 824-480.13q0 70.67-26.84 133.41-26.84 62.73-73.92 109.86t-109.26 73.99Q551.81-136 480.13-136Zm-.13-32q130 0 221-91t91-221q0-130-91-221t-221-91q-130 0-221 91t-91 221q0 130 91 221t221 91Zm0-312Z"/></svg>

Agile Teams seeking better sprint outcomes with data-driven insights.

<svg xmlns="http://www.w3.org/2000/svg" height="20px" viewBox="0 -960 960 960" width="20px" fill="#ff6100"><path d="m427.46-410.31-73.84-72.84q-5.62-5.62-10.77-6-5.16-.39-11.54 6-6.39 6.38-6.39 11.65 0 5.27 6.39 11.65l76.54 76.54q8.69 8.69 19.61 8.69t19.62-8.69l180.07-180.07q5.62-5.62 6-11.27.39-5.66-6-12.04-6.38-6.39-11.15-6.39-4.77 0-11.15 6.39L427.46-410.31ZM480.13-136q-70.67 0-133.41-26.84-62.73-26.84-109.86-73.92t-73.99-109.76Q136-409.19 136-479.87q0-71.67 26.84-133.91 26.84-62.23 73.92-109.36t109.76-73.99Q409.19-824 479.87-824q71.67 0 133.91 26.84 62.23 26.84 109.36 73.92t73.99 109.26Q824-551.81 824-480.13q0 70.67-26.84 133.41-26.84 62.73-73.92 109.86t-109.26 73.99Q551.81-136 480.13-136Zm-.13-32q130 0 221-91t91-221q0-130-91-221t-221-91q-130 0-221 91t-91 221q0 130 91 221t221 91Zm0-312Z"/></svg>

Software Engineers wanting to measure efficiency and development speed.

<svg xmlns="http://www.w3.org/2000/svg" height="20px" viewBox="0 -960 960 960" width="20px" fill="#ff6100"><path d="m427.46-410.31-73.84-72.84q-5.62-5.62-10.77-6-5.16-.39-11.54 6-6.39 6.38-6.39 11.65 0 5.27 6.39 11.65l76.54 76.54q8.69 8.69 19.61 8.69t19.62-8.69l180.07-180.07q5.62-5.62 6-11.27.39-5.66-6-12.04-6.38-6.39-11.15-6.39-4.77 0-11.15 6.39L427.46-410.31ZM480.13-136q-70.67 0-133.41-26.84-62.73-26.84-109.86-73.92t-73.99-109.76Q136-409.19 136-479.87q0-71.67 26.84-133.91 26.84-62.23 73.92-109.36t109.76-73.99Q409.19-824 479.87-824q71.67 0 133.91 26.84 62.23 26.84 109.36 73.92t73.99 109.26Q824-551.81 824-480.13q0 70.67-26.84 133.41-26.84 62.73-73.92 109.86t-109.26 73.99Q551.81-136 480.13-136Zm-.13-32q130 0 221-91t91-221q0-130-91-221t-221-91q-130 0-221 91t-91 221q0 130 91 221t221 91Zm0-312Z"/></svg>

DevOps Teams focused on improving collaboration and delivery pipelines.

<svg xmlns="http://www.w3.org/2000/svg" height="20px" viewBox="0 -960 960 960" width="20px" fill="#ff6100"><path d="m427.46-410.31-73.84-72.84q-5.62-5.62-10.77-6-5.16-.39-11.54 6-6.39 6.38-6.39 11.65 0 5.27 6.39 11.65l76.54 76.54q8.69 8.69 19.61 8.69t19.62-8.69l180.07-180.07q5.62-5.62 6-11.27.39-5.66-6-12.04-6.38-6.39-11.15-6.39-4.77 0-11.15 6.39L427.46-410.31ZM480.13-136q-70.67 0-133.41-26.84-62.73-26.84-109.86-73.92t-73.99-109.76Q136-409.19 136-479.87q0-71.67 26.84-133.91 26.84-62.23 73.92-109.36t109.76-73.99Q409.19-824 479.87-824q71.67 0 133.91 26.84 62.23 26.84 109.36 73.92t73.99 109.26Q824-551.81 824-480.13q0 70.67-26.84 133.41-26.84 62.73-73.92 109.86t-109.26 73.99Q551.81-136 480.13-136Zm-.13-32q130 0 221-91t91-221q0-130-91-221t-221-91q-130 0-221 91t-91 221q0 130 91 221t221 91Zm0-312Z"/></svg>

Developers aiming to enhance their daily workflows through better metrics.


Recommended Resources from Plandek