Accelerate your delivery. Join our Metrics Masterclass webinar to unlock the power of Speed metrics to move faster and deliver smarter. Register now>

Unlock DevOps Success with Key Metrics

Discover how to track and optimize DevOps performance with actionable metrics and SEI platforms.

devops-metrics-sei-guide

Here’s what you’ll get:

<svg xmlns="http://www.w3.org/2000/svg" height="20px" viewBox="0 -960 960 960" width="20px" fill="#ff6100"><path d="m427.46-410.31-73.84-72.84q-5.62-5.62-10.77-6-5.16-.39-11.54 6-6.39 6.38-6.39 11.65 0 5.27 6.39 11.65l76.54 76.54q8.69 8.69 19.61 8.69t19.62-8.69l180.07-180.07q5.62-5.62 6-11.27.39-5.66-6-12.04-6.38-6.39-11.15-6.39-4.77 0-11.15 6.39L427.46-410.31ZM480.13-136q-70.67 0-133.41-26.84-62.73-26.84-109.86-73.92t-73.99-109.76Q136-409.19 136-479.87q0-71.67 26.84-133.91 26.84-62.23 73.92-109.36t109.76-73.99Q409.19-824 479.87-824q71.67 0 133.91 26.84 62.23 26.84 109.36 73.92t73.99 109.26Q824-551.81 824-480.13q0 70.67-26.84 133.41-26.84 62.73-73.92 109.86t-109.26 73.99Q551.81-136 480.13-136Zm-.13-32q130 0 221-91t91-221q0-130-91-221t-221-91q-130 0-221 91t-91 221q0 130 91 221t221 91Zm0-312Z"/></svg>The hype and expectations around DevOps SEI Platforms

<svg xmlns="http://www.w3.org/2000/svg" height="20px" viewBox="0 -960 960 960" width="20px" fill="#ff6100"><path d="m427.46-410.31-73.84-72.84q-5.62-5.62-10.77-6-5.16-.39-11.54 6-6.39 6.38-6.39 11.65 0 5.27 6.39 11.65l76.54 76.54q8.69 8.69 19.61 8.69t19.62-8.69l180.07-180.07q5.62-5.62 6-11.27.39-5.66-6-12.04-6.38-6.39-11.15-6.39-4.77 0-11.15 6.39L427.46-410.31ZM480.13-136q-70.67 0-133.41-26.84-62.73-26.84-109.86-73.92t-73.99-109.76Q136-409.19 136-479.87q0-71.67 26.84-133.91 26.84-62.23 73.92-109.36t109.76-73.99Q409.19-824 479.87-824q71.67 0 133.91 26.84 62.23 26.84 109.36 73.92t73.99 109.26Q824-551.81 824-480.13q0 70.67-26.84 133.41-26.84 62.73-73.92 109.86t-109.26 73.99Q551.81-136 480.13-136Zm-.13-32q130 0 221-91t91-221q0-130-91-221t-221-91q-130 0-221 91t-91 221q0 130 91 221t221 91Zm0-312Z"/></svg>Choosing & implementing the right platform for your DevOps success

<svg xmlns="http://www.w3.org/2000/svg" height="20px" viewBox="0 -960 960 960" width="20px" fill="#ff6100"><path d="m427.46-410.31-73.84-72.84q-5.62-5.62-10.77-6-5.16-.39-11.54 6-6.39 6.38-6.39 11.65 0 5.27 6.39 11.65l76.54 76.54q8.69 8.69 19.61 8.69t19.62-8.69l180.07-180.07q5.62-5.62 6-11.27.39-5.66-6-12.04-6.38-6.39-11.15-6.39-4.77 0-11.15 6.39L427.46-410.31ZM480.13-136q-70.67 0-133.41-26.84-62.73-26.84-109.86-73.92t-73.99-109.76Q136-409.19 136-479.87q0-71.67 26.84-133.91 26.84-62.23 73.92-109.36t109.76-73.99Q409.19-824 479.87-824q71.67 0 133.91 26.84 62.23 26.84 109.36 73.92t73.99 109.26Q824-551.81 824-480.13q0 70.67-26.84 133.41-26.84 62.73-73.92 109.86t-109.26 73.99Q551.81-136 480.13-136Zm-.13-32q130 0 221-91t91-221q0-130-91-221t-221-91q-130 0-221 91t-91 221q0 130 91 221t221 91Zm0-312Z"/></svg>Relevant DevOps metrics to implement across your business

Discover how to track and optimize DevOps performance with actionable metrics and SEI platforms.

Here’s what you’ll get:

<svg xmlns="http://www.w3.org/2000/svg" height="20px" viewBox="0 -960 960 960" width="20px" fill="#ff6100"><path d="m427.46-410.31-73.84-72.84q-5.62-5.62-10.77-6-5.16-.39-11.54 6-6.39 6.38-6.39 11.65 0 5.27 6.39 11.65l76.54 76.54q8.69 8.69 19.61 8.69t19.62-8.69l180.07-180.07q5.62-5.62 6-11.27.39-5.66-6-12.04-6.38-6.39-11.15-6.39-4.77 0-11.15 6.39L427.46-410.31ZM480.13-136q-70.67 0-133.41-26.84-62.73-26.84-109.86-73.92t-73.99-109.76Q136-409.19 136-479.87q0-71.67 26.84-133.91 26.84-62.23 73.92-109.36t109.76-73.99Q409.19-824 479.87-824q71.67 0 133.91 26.84 62.23 26.84 109.36 73.92t73.99 109.26Q824-551.81 824-480.13q0 70.67-26.84 133.41-26.84 62.73-73.92 109.86t-109.26 73.99Q551.81-136 480.13-136Zm-.13-32q130 0 221-91t91-221q0-130-91-221t-221-91q-130 0-221 91t-91 221q0 130 91 221t221 91Zm0-312Z"/></svg>The hype and expectations around DevOps SEI Platforms

<svg xmlns="http://www.w3.org/2000/svg" height="20px" viewBox="0 -960 960 960" width="20px" fill="#ff6100"><path d="m427.46-410.31-73.84-72.84q-5.62-5.62-10.77-6-5.16-.39-11.54 6-6.39 6.38-6.39 11.65 0 5.27 6.39 11.65l76.54 76.54q8.69 8.69 19.61 8.69t19.62-8.69l180.07-180.07q5.62-5.62 6-11.27.39-5.66-6-12.04-6.38-6.39-11.15-6.39-4.77 0-11.15 6.39L427.46-410.31ZM480.13-136q-70.67 0-133.41-26.84-62.73-26.84-109.86-73.92t-73.99-109.76Q136-409.19 136-479.87q0-71.67 26.84-133.91 26.84-62.23 73.92-109.36t109.76-73.99Q409.19-824 479.87-824q71.67 0 133.91 26.84 62.23 26.84 109.36 73.92t73.99 109.26Q824-551.81 824-480.13q0 70.67-26.84 133.41-26.84 62.73-73.92 109.86t-109.26 73.99Q551.81-136 480.13-136Zm-.13-32q130 0 221-91t91-221q0-130-91-221t-221-91q-130 0-221 91t-91 221q0 130 91 221t221 91Zm0-312Z"/></svg>Choosing & implementing the right platform for your DevOps success

<svg xmlns="http://www.w3.org/2000/svg" height="20px" viewBox="0 -960 960 960" width="20px" fill="#ff6100"><path d="m427.46-410.31-73.84-72.84q-5.62-5.62-10.77-6-5.16-.39-11.54 6-6.39 6.38-6.39 11.65 0 5.27 6.39 11.65l76.54 76.54q8.69 8.69 19.61 8.69t19.62-8.69l180.07-180.07q5.62-5.62 6-11.27.39-5.66-6-12.04-6.38-6.39-11.15-6.39-4.77 0-11.15 6.39L427.46-410.31ZM480.13-136q-70.67 0-133.41-26.84-62.73-26.84-109.86-73.92t-73.99-109.76Q136-409.19 136-479.87q0-71.67 26.84-133.91 26.84-62.23 73.92-109.36t109.76-73.99Q409.19-824 479.87-824q71.67 0 133.91 26.84 62.23 26.84 109.36 73.92t73.99 109.26Q824-551.81 824-480.13q0 70.67-26.84 133.41-26.84 62.73-73.92 109.86t-109.26 73.99Q551.81-136 480.13-136Zm-.13-32q130 0 221-91t91-221q0-130-91-221t-221-91q-130 0-221 91t-91 221q0 130 91 221t221 91Zm0-312Z"/></svg>Relevant DevOps metrics to implement across your business

plandek-badges

Why Metrics Matter in DevOps

In today’s fast-paced software development environment, tracking the right DevOps metrics is essential for success. Whether you’re automating workflows, improving collaboration, or speeding up delivery, data-driven insights help optimize your pipeline. DevOps metrics provide visibility into each stage of the software delivery lifecycle, enabling teams to identify bottlenecks, reduce downtime, and make informed decisions that drive continuous improvement. By focusing on key metrics like deployment frequency, lead time for changes, and mean time to recovery, organizations can enhance both efficiency and quality. Moreover, these metrics align teams with business goals, ensuring that your DevOps initiatives are not only technically sound but also contribute to greater agility and profitability. As software development becomes increasingly complex, a robust metrics strategy is crucial for scaling operations and maintaining a competitive edge.

How SEI Platforms Empower DevOps Teams

SEI Platforms: The Future of DevOps Optimization

Software Engineering Intelligence (SEI) platforms provide comprehensive visibility into the health of your DevOps pipeline. By integrating advanced analytics, these platforms offer real-time insights into:

  • Team productivity
  • Code quality
  • Automation efficiency
  • Pipeline performance


With an SEI platform, DevOps teams can make faster, data-driven decisions, improve deployment times, and reduce risk.

The Key DevOps Metrics to Track

Essential DevOps Metrics to Drive Performance

Metrics are the backbone of effective DevOps. By tracking the right data points, teams can ensure their pipelines are optimized, delivery speeds increase, and overall efficiency improves.

Here are the key metrics covered for DevOps teams:

devops-metrics-cycle-time

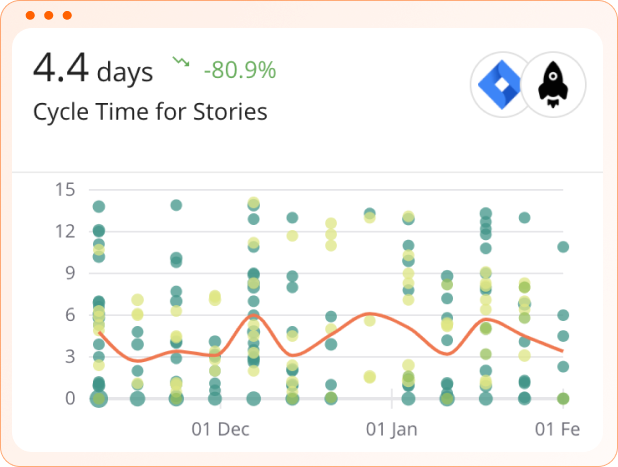
Track the time it takes from task creation to completion.

Cycle time measures how long it takes for tasks to move through your development pipeline from start to finish. By tracking this metric, teams can pinpoint inefficiencies, eliminate delays, and accelerate the overall delivery process. A shorter cycle time indicates a more efficient workflow, allowing teams to respond quickly to changing priorities and market demands.

devops-metrics-lead-time-for-changes

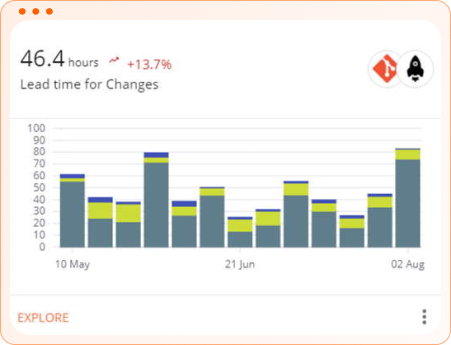
Speed to success: Minimize lead time and maximize impact.

Lead time for changes tracks the duration between code commit and production deployment. This metric is crucial for understanding how quickly your team can implement new features, updates, or fixes. Shortening the lead time helps improve agility, enabling faster feedback loops and a quicker time to value for customers.

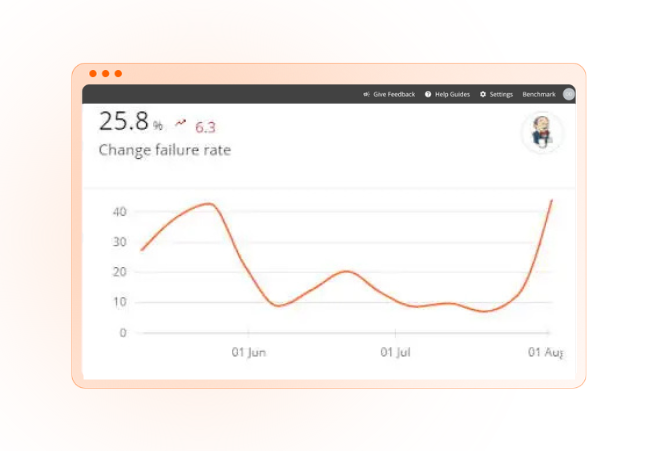
Lower change failures to boost stability.

Change failure rate measures the percentage of changes that lead to incidents or require remediation, such as rollbacks or hotfixes. A lower failure rate reflects a more stable, reliable development process. Tracking this metric allows teams to identify risks early and continuously improve their testing and deployment practices.

devops-metrics-deployment-frequency

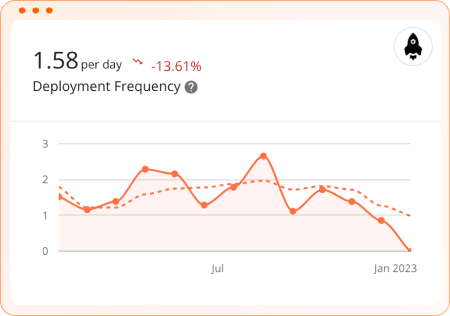
Increase deployment frequency for faster innovations.

Deployment frequency measures how often your team releases new features, updates, or bug fixes into production. Higher deployment frequency often correlates with a more iterative, agile approach to development, enabling faster innovation. Regular deployments not only enhance user satisfaction but also reduce the complexity of each release, making issues easier to manage.

Trusted by global technology companies

Download The Practical Guide to SEI Platforms

Unlock the full potential of your software delivery processes with Plandek’s Practical Guide to SEI Platforms. This essential guide delves into the world of Software Engineering Intelligence (SEI), offering valuable insights into how these platforms can transform DevOps teams.

What’s in the Guide?
In this guide, you’ll discover how SEI platforms enable teams to:

<svg xmlns="http://www.w3.org/2000/svg" height="20px" viewBox="0 -960 960 960" width="20px" fill="#ff6100"><path d="m427.46-410.31-73.84-72.84q-5.62-5.62-10.77-6-5.16-.39-11.54 6-6.39 6.38-6.39 11.65 0 5.27 6.39 11.65l76.54 76.54q8.69 8.69 19.61 8.69t19.62-8.69l180.07-180.07q5.62-5.62 6-11.27.39-5.66-6-12.04-6.38-6.39-11.15-6.39-4.77 0-11.15 6.39L427.46-410.31ZM480.13-136q-70.67 0-133.41-26.84-62.73-26.84-109.86-73.92t-73.99-109.76Q136-409.19 136-479.87q0-71.67 26.84-133.91 26.84-62.23 73.92-109.36t109.76-73.99Q409.19-824 479.87-824q71.67 0 133.91 26.84 62.23 26.84 109.36 73.92t73.99 109.26Q824-551.81 824-480.13q0 70.67-26.84 133.41-26.84 62.73-73.92 109.86t-109.26 73.99Q551.81-136 480.13-136Zm-.13-32q130 0 221-91t91-221q0-130-91-221t-221-91q-130 0-221 91t-91 221q0 130 91 221t221 91Zm0-312Z"/></svg>Gain real-time visibility into key DevOps metrics and pipeline health

<svg xmlns="http://www.w3.org/2000/svg" height="20px" viewBox="0 -960 960 960" width="20px" fill="#ff6100"><path d="m427.46-410.31-73.84-72.84q-5.62-5.62-10.77-6-5.16-.39-11.54 6-6.39 6.38-6.39 11.65 0 5.27 6.39 11.65l76.54 76.54q8.69 8.69 19.61 8.69t19.62-8.69l180.07-180.07q5.62-5.62 6-11.27.39-5.66-6-12.04-6.38-6.39-11.15-6.39-4.77 0-11.15 6.39L427.46-410.31ZM480.13-136q-70.67 0-133.41-26.84-62.73-26.84-109.86-73.92t-73.99-109.76Q136-409.19 136-479.87q0-71.67 26.84-133.91 26.84-62.23 73.92-109.36t109.76-73.99Q409.19-824 479.87-824q71.67 0 133.91 26.84 62.23 26.84 109.36 73.92t73.99 109.26Q824-551.81 824-480.13q0 70.67-26.84 133.41-26.84 62.73-73.92 109.86t-109.26 73.99Q551.81-136 480.13-136Zm-.13-32q130 0 221-91t91-221q0-130-91-221t-221-91q-130 0-221 91t-91 221q0 130 91 221t221 91Zm0-312Z"/></svg>Automate data-driven decisions to improve workflow efficiency and reduce delivery bottlenecks

<svg xmlns="http://www.w3.org/2000/svg" height="20px" viewBox="0 -960 960 960" width="20px" fill="#ff6100"><path d="m427.46-410.31-73.84-72.84q-5.62-5.62-10.77-6-5.16-.39-11.54 6-6.39 6.38-6.39 11.65 0 5.27 6.39 11.65l76.54 76.54q8.69 8.69 19.61 8.69t19.62-8.69l180.07-180.07q5.62-5.62 6-11.27.39-5.66-6-12.04-6.38-6.39-11.15-6.39-4.77 0-11.15 6.39L427.46-410.31ZM480.13-136q-70.67 0-133.41-26.84-62.73-26.84-109.86-73.92t-73.99-109.76Q136-409.19 136-479.87q0-71.67 26.84-133.91 26.84-62.23 73.92-109.36t109.76-73.99Q409.19-824 479.87-824q71.67 0 133.91 26.84 62.23 26.84 109.36 73.92t73.99 109.26Q824-551.81 824-480.13q0 70.67-26.84 133.41-26.84 62.73-73.92 109.86t-109.26 73.99Q551.81-136 480.13-136Zm-.13-32q130 0 221-91t91-221q0-130-91-221t-221-91q-130 0-221 91t-91 221q0 130 91 221t221 91Zm0-312Z"/></svg>

Enhance collaboration between teams with integrated tools that track performance across the entire development lifecycle

<svg xmlns="http://www.w3.org/2000/svg" height="20px" viewBox="0 -960 960 960" width="20px" fill="#ff6100"><path d="m427.46-410.31-73.84-72.84q-5.62-5.62-10.77-6-5.16-.39-11.54 6-6.39 6.38-6.39 11.65 0 5.27 6.39 11.65l76.54 76.54q8.69 8.69 19.61 8.69t19.62-8.69l180.07-180.07q5.62-5.62 6-11.27.39-5.66-6-12.04-6.38-6.39-11.15-6.39-4.77 0-11.15 6.39L427.46-410.31ZM480.13-136q-70.67 0-133.41-26.84-62.73-26.84-109.86-73.92t-73.99-109.76Q136-409.19 136-479.87q0-71.67 26.84-133.91 26.84-62.23 73.92-109.36t109.76-73.99Q409.19-824 479.87-824q71.67 0 133.91 26.84 62.23 26.84 109.36 73.92t73.99 109.26Q824-551.81 824-480.13q0 70.67-26.84 133.41-26.84 62.73-73.92 109.86t-109.26 73.99Q551.81-136 480.13-136Zm-.13-32q130 0 221-91t91-221q0-130-91-221t-221-91q-130 0-221 91t-91 221q0 130 91 221t221 91Zm0-312Z"/></svg>Boost software delivery speed by optimizing key metrics like cycle time, deployment frequency, and change failure rate

Whether you’re looking to implement continuous integration (CI), continuous delivery (CD), or both, this guide provides practical steps for leveraging SEI platforms to drive measurable improvements in your DevOps operations.

devops-metrics-sei-guide

Trusted by DevOps Teams Globally

Plandek: Empowering DevOps with Intelligent Metrics

plandek-north-star

At Plandek, we provide data-driven insights that empower DevOps teams to track and improve their performance. Our Software Engineering Intelligence (SEI) platform offers a powerful set of tools to monitor key metrics, automate workflows, and drive continuous improvement.

By partnering with Plandek, you gain access to actionable insights that help your team:

<svg xmlns="http://www.w3.org/2000/svg" height="20px" viewBox="0 -960 960 960" width="20px" fill="#ff6100"><path d="M666.15-464H247.98q-6.83 0-11.41-4.52-4.57-4.52-4.57-11.27t4.57-11.48q4.58-4.73 11.41-4.73h418.17L468.4-693.75q-4.63-4.63-5.4-11.06-.77-6.42 4.85-12.51 5.61-5.91 11.65-5.53 6.04.39 11.46 5.83l217.02 217.31q4.64 4.64 6.75 9.42 2.12 4.77 2.12 10.45t-2.12 10.45q-2.11 4.77-6.35 9.01L491.15-243.15q-5.61 5.61-11.15 5.5-5.54-.12-11.15-6.03-5.62-6.09-5.62-11.91t5.62-11.1L666.15-464Z"/></svg>Deliver software faster.
<svg xmlns="http://www.w3.org/2000/svg" height="20px" viewBox="0 -960 960 960" width="20px" fill="#ff6100"><path d="M666.15-464H247.98q-6.83 0-11.41-4.52-4.57-4.52-4.57-11.27t4.57-11.48q4.58-4.73 11.41-4.73h418.17L468.4-693.75q-4.63-4.63-5.4-11.06-.77-6.42 4.85-12.51 5.61-5.91 11.65-5.53 6.04.39 11.46 5.83l217.02 217.31q4.64 4.64 6.75 9.42 2.12 4.77 2.12 10.45t-2.12 10.45q-2.11 4.77-6.35 9.01L491.15-243.15q-5.61 5.61-11.15 5.5-5.54-.12-11.15-6.03-5.62-6.09-5.62-11.91t5.62-11.1L666.15-464Z"/></svg>Increase deployment success rates.
<svg xmlns="http://www.w3.org/2000/svg" height="20px" viewBox="0 -960 960 960" width="20px" fill="#ff6100"><path d="M666.15-464H247.98q-6.83 0-11.41-4.52-4.57-4.52-4.57-11.27t4.57-11.48q4.58-4.73 11.41-4.73h418.17L468.4-693.75q-4.63-4.63-5.4-11.06-.77-6.42 4.85-12.51 5.61-5.91 11.65-5.53 6.04.39 11.46 5.83l217.02 217.31q4.64 4.64 6.75 9.42 2.12 4.77 2.12 10.45t-2.12 10.45q-2.11 4.77-6.35 9.01L491.15-243.15q-5.61 5.61-11.15 5.5-5.54-.12-11.15-6.03-5.62-6.09-5.62-11.91t5.62-11.1L666.15-464Z"/></svg>Optimize resource allocation.

To experience Plandek for yourself, book a free demonstration with one of our expert consultants, or download our Intro Deck to discover how Plandek can take your DevOps pipeline to the next level and maximize performance across your team.

Recommended Resources from Plandek